
By CountingPips.com – Receive our weekly COT Reports by Email
Here are the latest charts and statistics for the Commitment of Traders (COT) data published by the Commodities Futures Trading Commission (CFTC).
The latest COT data is updated through Tuesday April 06 2021 and shows a quick view of how large traders (for-profit speculators and commercial entities) were positioned in the futures markets.
VIX Volatility Futures: Futures:
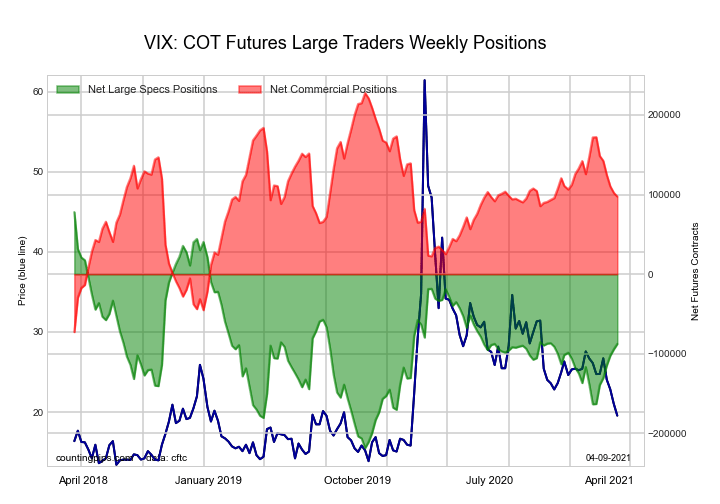
The VIX Volatility Futures: large speculator standing this week recorded a net position of -87,573 contracts in the data reported through Tuesday. This was a weekly lift of 6,817 contracts from the previous week which had a total of -94,390 net contracts.
This week’s current strength score (the trader positioning range over the past three years, measured from 0 to 100) shows the speculators are currently Bearish with a score of 44.1 percent. The commercials are Bullish with a score of 56.7 percent and the small traders (not shown in chart) are Bearish-Extreme with a score of 18.9 percent.
Free Reports:
 Get our Weekly Commitment of Traders Reports - See where the biggest traders (Hedge Funds and Commercial Hedgers) are positioned in the futures markets on a weekly basis.
 Download Our Metatrader 4 Indicators – Put Our Free MetaTrader 4 Custom Indicators on your charts when you join our Weekly Newsletter
| VIX Volatility Futures Statistics | SPECULATORS | COMMERCIALS | SMALL TRADERS |
| – Percent of Open Interest Longs: | 19.0 | 56.5 | 5.5 |
| – Percent of Open Interest Shorts: | 43.0 | 29.8 | 8.2 |
| – Net Position: | -87,573 | 97,456 | -9,883 |
| – Gross Longs: | 69,212 | 205,871 | 20,056 |
| – Gross Shorts: | 156,785 | 108,415 | 29,939 |
| – Long to Short Ratio: | 0.4 to 1 | 1.9 to 1 | 0.7 to 1 |
| NET POSITION TREND: | |||
| – COT Index Score (3 Year Range Pct): | 44.1 | 56.7 | 18.9 |
| – COT Index Reading (3 Year Range): | Bearish | Bullish | Bearish-Extreme |
| NET POSITION MOVEMENT INDEX: | |||
| – 6-Week Change in Strength Index: | 25.4 | -24.9 | -2.6 |
S&P500 Mini Futures: Futures:
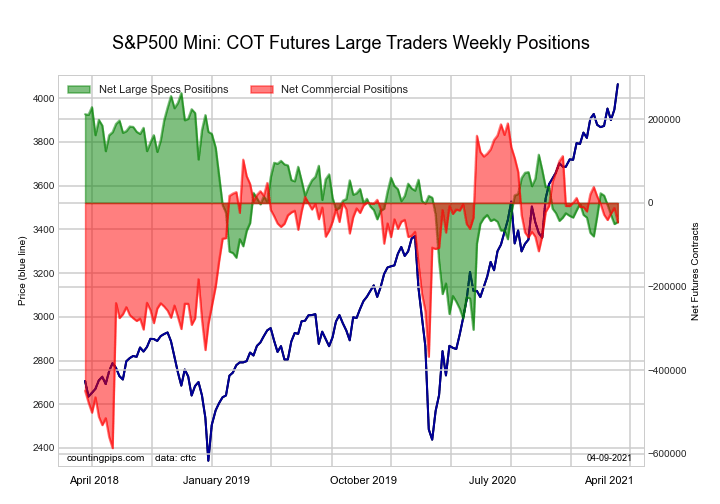
The S&P500 Mini Futures: large speculator standing this week recorded a net position of -45,343 contracts in the data reported through Tuesday. This was a weekly rise of 4,988 contracts from the previous week which had a total of -50,331 net contracts.
This week’s current strength score (the trader positioning range over the past three years, measured from 0 to 100) shows the speculators are currently Bearish with a score of 45.6 percent. The commercials are Bullish with a score of 69.5 percent and the small traders (not shown in chart) are Bearish with a score of 40.0 percent.
| S&P500 Mini Futures Statistics | SPECULATORS | COMMERCIALS | SMALL TRADERS |
| – Percent of Open Interest Longs: | 13.1 | 73.1 | 12.1 |
| – Percent of Open Interest Shorts: | 14.8 | 74.9 | 8.6 |
| – Net Position: | -45,343 | -46,323 | 91,666 |
| – Gross Longs: | 341,622 | 1,908,972 | 316,050 |
| – Gross Shorts: | 386,965 | 1,955,295 | 224,384 |
| – Long to Short Ratio: | 0.9 to 1 | 1.0 to 1 | 1.4 to 1 |
| NET POSITION TREND: | |||
| – COT Index Score (3 Year Range Pct): | 45.6 | 69.5 | 40.0 |
| – COT Index Reading (3 Year Range): | Bearish | Bullish | Bearish |
| NET POSITION MOVEMENT INDEX: | |||
| – 6-Week Change in Strength Index: | -2.5 | -8.0 | 14.0 |
Dow Jones Mini Futures: Futures:
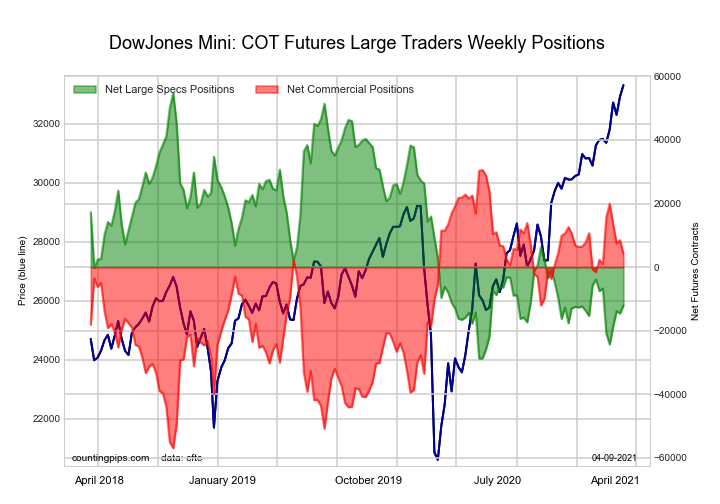
The Dow Jones Mini Futures: large speculator standing this week recorded a net position of -12,055 contracts in the data reported through Tuesday. This was a weekly increase of 2,495 contracts from the previous week which had a total of -14,550 net contracts.
This week’s current strength score (the trader positioning range over the past three years, measured from 0 to 100) shows the speculators are currently Bearish-Extreme with a score of 20.0 percent. The commercials are Bullish with a score of 69.8 percent and the small traders (not shown in chart) are Bullish-Extreme with a score of 93.4 percent.
| Dow Jones Mini Futures Statistics | SPECULATORS | COMMERCIALS | SMALL TRADERS |
| – Percent of Open Interest Longs: | 28.3 | 47.0 | 21.5 |
| – Percent of Open Interest Shorts: | 41.1 | 42.6 | 13.1 |
| – Net Position: | -12,055 | 4,134 | 7,921 |
| – Gross Longs: | 26,641 | 44,323 | 20,301 |
| – Gross Shorts: | 38,696 | 40,189 | 12,380 |
| – Long to Short Ratio: | 0.7 to 1 | 1.1 to 1 | 1.6 to 1 |
| NET POSITION TREND: | |||
| – COT Index Score (3 Year Range Pct): | 20.0 | 69.8 | 93.4 |
| – COT Index Reading (3 Year Range): | Bearish-Extreme | Bullish | Bullish-Extreme |
| NET POSITION MOVEMENT INDEX: | |||
| – 6-Week Change in Strength Index: | -6.4 | 3.6 | 13.7 |
Nasdaq Mini Futures: Futures:
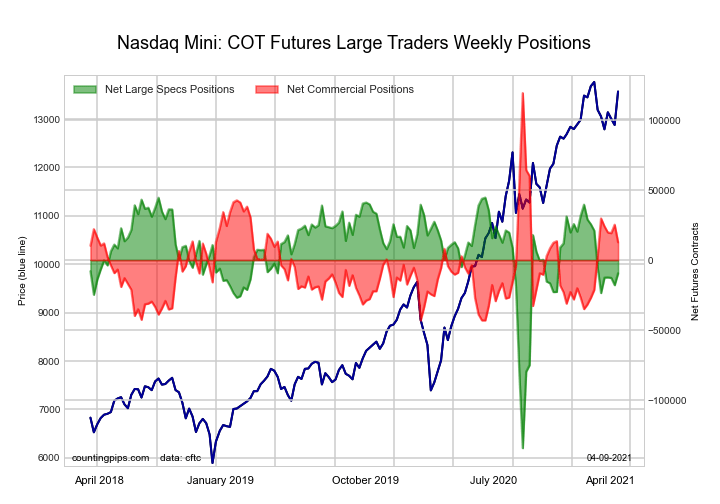
The Nasdaq Mini Futures: large speculator standing this week recorded a net position of -9,396 contracts in the data reported through Tuesday. This was a weekly boost of 8,469 contracts from the previous week which had a total of -17,865 net contracts.
This week’s current strength score (the trader positioning range over the past three years, measured from 0 to 100) shows the speculators are currently Bullish with a score of 69.8 percent. The commercials are Bearish with a score of 34.3 percent and the small traders (not shown in chart) are Bearish with a score of 36.5 percent.
| Nasdaq Mini Futures Statistics | SPECULATORS | COMMERCIALS | SMALL TRADERS |
| – Percent of Open Interest Longs: | 26.8 | 55.5 | 16.3 |
| – Percent of Open Interest Shorts: | 31.1 | 49.5 | 17.9 |
| – Net Position: | -9,396 | 12,730 | -3,334 |
| – Gross Longs: | 57,439 | 119,018 | 35,071 |
| – Gross Shorts: | 66,835 | 106,288 | 38,405 |
| – Long to Short Ratio: | 0.9 to 1 | 1.1 to 1 | 0.9 to 1 |
| NET POSITION TREND: | |||
| – COT Index Score (3 Year Range Pct): | 69.8 | 34.3 | 36.5 |
| – COT Index Reading (3 Year Range): | Bullish | Bearish | Bearish |
| NET POSITION MOVEMENT INDEX: | |||
| – 6-Week Change in Strength Index: | -2.2 | 6.1 | -13.1 |
Russell 2000 Mini Futures: Futures:
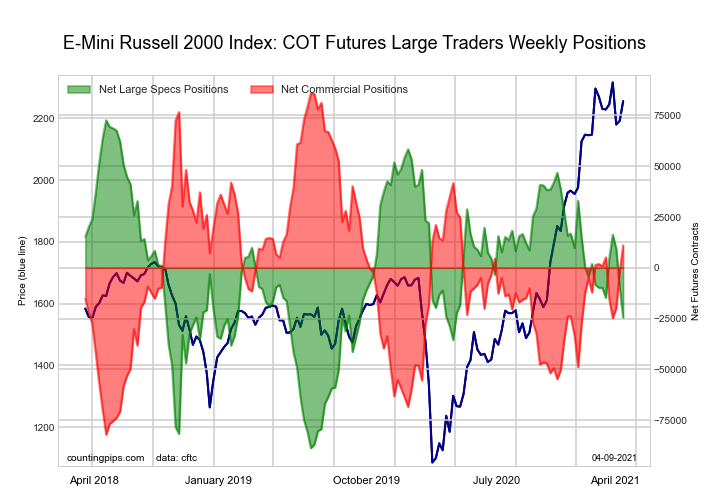
The Russell 2000 Mini Futures: large speculator standing this week recorded a net position of -24,398 contracts in the data reported through Tuesday. This was a weekly decrease of -14,398 contracts from the previous week which had a total of -10,000 net contracts.
This week’s current strength score (the trader positioning range over the past three years, measured from 0 to 100) shows the speculators are currently Bearish with a score of 39.9 percent. The commercials are Bullish with a score of 55.4 percent and the small traders (not shown in chart) are Bullish with a score of 70.8 percent.
| Russell 2000 Mini Futures Statistics | SPECULATORS | COMMERCIALS | SMALL TRADERS |
| – Percent of Open Interest Longs: | 12.3 | 80.8 | 6.5 |
| – Percent of Open Interest Shorts: | 17.4 | 78.5 | 3.7 |
| – Net Position: | -24,398 | 11,025 | 13,373 |
| – Gross Longs: | 57,946 | 382,080 | 30,669 |
| – Gross Shorts: | 82,344 | 371,055 | 17,296 |
| – Long to Short Ratio: | 0.7 to 1 | 1.0 to 1 | 1.8 to 1 |
| NET POSITION TREND: | |||
| – COT Index Score (3 Year Range Pct): | 39.9 | 55.4 | 70.8 |
| – COT Index Reading (3 Year Range): | Bearish | Bullish | Bullish |
| NET POSITION MOVEMENT INDEX: | |||
| – 6-Week Change in Strength Index: | -9.0 | 6.1 | 12.3 |
Nikkei Stock Average Futures (USD): Futures:
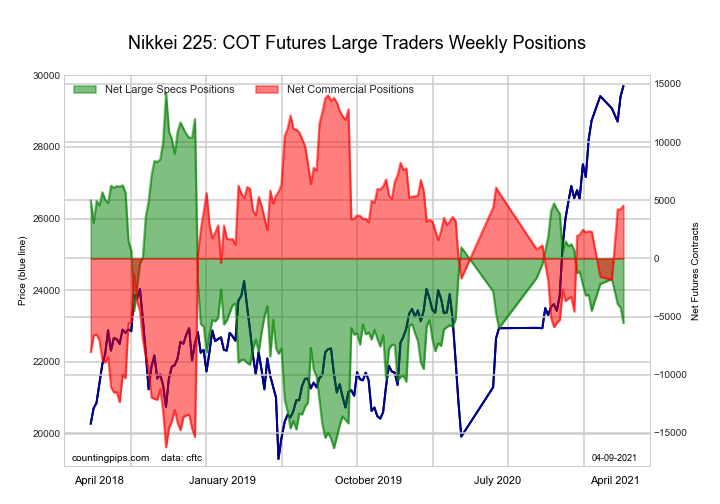
The Nikkei Stock Average Futures (USD): large speculator standing this week recorded a net position of -5,553 contracts in the data reported through Tuesday. This was a weekly lowering of -1,349 contracts from the previous week which had a total of -4,204 net contracts.
This week’s current strength score (the trader positioning range over the past three years, measured from 0 to 100) shows the speculators are currently Bearish with a score of 35.2 percent. The commercials are Bullish with a score of 68.7 percent and the small traders (not shown in chart) are Bearish with a score of 30.4 percent.
| Nikkei Stock Average Futures Statistics | SPECULATORS | COMMERCIALS | SMALL TRADERS |
| – Percent of Open Interest Longs: | 10.4 | 55.4 | 34.1 |
| – Percent of Open Interest Shorts: | 47.7 | 24.8 | 27.4 |
| – Net Position: | -5,553 | 4,548 | 1,005 |
| – Gross Longs: | 1,542 | 8,239 | 5,071 |
| – Gross Shorts: | 7,095 | 3,691 | 4,066 |
| – Long to Short Ratio: | 0.2 to 1 | 2.2 to 1 | 1.2 to 1 |
| NET POSITION TREND: | |||
| – COT Index Score (3 Year Range Pct): | 35.2 | 68.7 | 30.4 |
| – COT Index Reading (3 Year Range): | Bearish | Bullish | Bearish |
| NET POSITION MOVEMENT INDEX: | |||
| – 6-Week Change in Strength Index: | -8.0 | 7.3 | 2.6 |
MSCI EAFE Mini Futures: Futures:
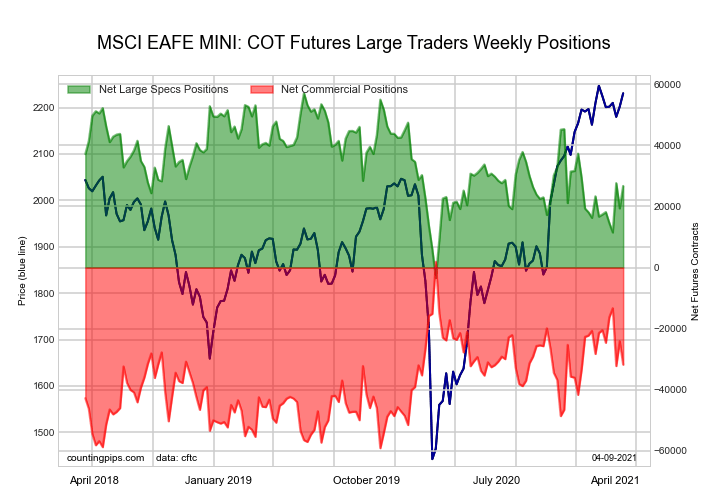
The MSCI EAFE Mini Futures: large speculator standing this week recorded a net position of 26,731 contracts in the data reported through Tuesday. This was a weekly increase of 7,338 contracts from the previous week which had a total of 19,393 net contracts.
This week’s current strength score (the trader positioning range over the past three years, measured from 0 to 100) shows the speculators are currently Bearish with a score of 49.7 percent. The commercials are Bearish with a score of 44.8 percent and the small traders (not shown in chart) are Bullish with a score of 62.1 percent.
| MSCI EAFE Mini Futures Statistics | SPECULATORS | COMMERCIALS | SMALL TRADERS |
| – Percent of Open Interest Longs: | 8.8 | 88.4 | 2.5 |
| – Percent of Open Interest Shorts: | 2.3 | 96.2 | 1.2 |
| – Net Position: | 26,731 | -31,821 | 5,090 |
| – Gross Longs: | 35,992 | 362,670 | 10,147 |
| – Gross Shorts: | 9,261 | 394,491 | 5,057 |
| – Long to Short Ratio: | 3.9 to 1 | 0.9 to 1 | 2.0 to 1 |
| NET POSITION TREND: | |||
| – COT Index Score (3 Year Range Pct): | 49.7 | 44.8 | 62.1 |
| – COT Index Reading (3 Year Range): | Bearish | Bearish | Bullish |
| NET POSITION MOVEMENT INDEX: | |||
| – 6-Week Change in Strength Index: | 15.4 | -18.5 | 17.9 |
MSCI Emerging Mkts Mini Futures: Futures:
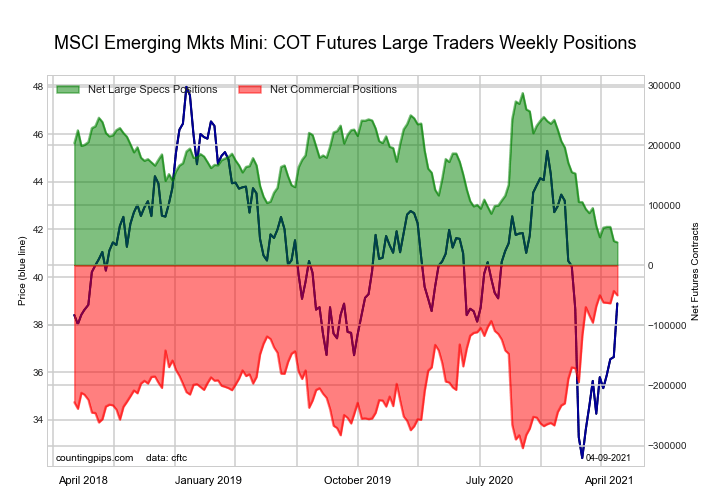
The MSCI Emerging Mkts Mini Futures: large speculator standing this week recorded a net position of 38,211 contracts in the data reported through Tuesday. This was a weekly decline of -2,219 contracts from the previous week which had a total of 40,430 net contracts.
This week’s current strength score (the trader positioning range over the past three years, measured from 0 to 100) shows the speculators are currently Bearish-Extreme with a score of 0.0 percent. The commercials are Bullish-Extreme with a score of 97.2 percent and the small traders (not shown in chart) are Bearish with a score of 40.4 percent.
| MSCI Emerging Mkts Mini Futures Statistics | SPECULATORS | COMMERCIALS | SMALL TRADERS |
| – Percent of Open Interest Longs: | 14.3 | 82.2 | 2.4 |
| – Percent of Open Interest Shorts: | 11.0 | 86.5 | 1.3 |
| – Net Position: | 38,211 | -49,886 | 11,675 |
| – Gross Longs: | 165,150 | 950,685 | 27,250 |
| – Gross Shorts: | 126,939 | 1,000,571 | 15,575 |
| – Long to Short Ratio: | 1.3 to 1 | 1.0 to 1 | 1.7 to 1 |
| NET POSITION TREND: | |||
| – COT Index Score (3 Year Range Pct): | 0.0 | 97.2 | 40.4 |
| – COT Index Reading (3 Year Range): | Bearish-Extreme | Bullish-Extreme | Bearish |
| NET POSITION MOVEMENT INDEX: | |||
| – 6-Week Change in Strength Index: | -11.0 | 6.8 | 7.3 |
Article By CountingPips.com – Receive our weekly COT Reports by Email
*COT Report: The COT data, released weekly to the public each Friday, is updated through the most recent Tuesday (data is 3 days old) and shows a quick view of how large speculators or non-commercials (for-profit traders) were positioned in the futures markets.
The CFTC categorizes trader positions according to commercial hedgers (traders who use futures contracts for hedging as part of the business), non-commercials (large traders who speculate to realize trading profits) and nonreportable traders (usually small traders/speculators).
Find CFTC criteria here: (http://www.cftc.gov/MarketReports/CommitmentsofTraders/ExplanatoryNotes/index.htm).

- FastSpring and EBANX Forge Partnership to Expand Pix Payments for Digital Products in Brazil Apr 25, 2024
- Target Thursdays: NAS100, Robusta Coffee, USDCHF Apr 25, 2024
- QCOM wants to create competition in the AI chip market. Hong Kong index hits five-month high Apr 25, 2024
- Japanese yen hits all-time low as BoJ meeting commences Apr 25, 2024
- TSLA shares rose on a weak report. Inflationary pressures are easing in Australia Apr 24, 2024
- USDJPY: On intervention watch Apr 24, 2024
- Euro gains against the dollar amid mixed economic signals Apr 24, 2024
- PMI data is the focus of investors’ attention today. Turkey, Iraq, Qatar, and UAE signed a transportation agreement Apr 23, 2024
- Australian dollar rises on strong economic indicators Apr 23, 2024
- Geopolitical risks in the Middle East are declining. China kept interest rates at lows Apr 22, 2024