
By CountingPips.com COT Home | Data Tables | Data Downloads | Newsletter
Here are the latest charts and statistics for the Commitment of Traders (COT) data published by the Commodities Futures Trading Commission (CFTC).
The latest COT data is updated through Tuesday April 13 2021 and shows a quick view of how large traders (for-profit speculators and commercial entities) were positioned in the futures markets.
VIX Volatility Futures Futures:
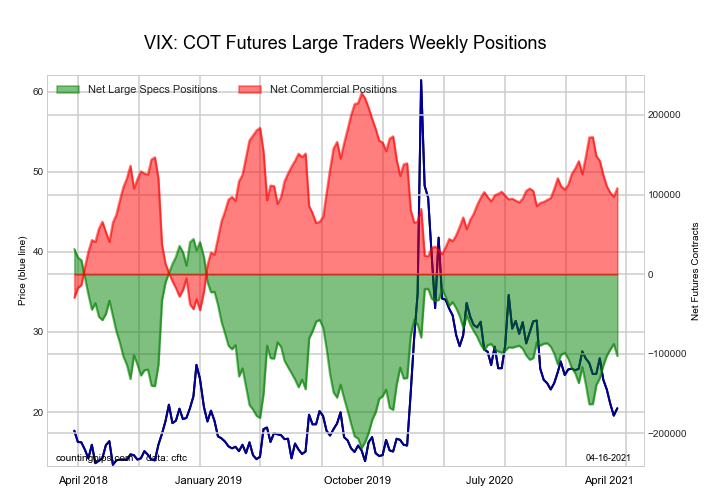
The VIX Volatility Futures large speculator standing this week resulted in a net position of -102,647 contracts in the data reported through Tuesday. This was a weekly reduction of -15,074 contracts from the previous week which had a total of -87,573 net contracts.
This week’s current strength score (the trader positioning range over the past three years, measured from 0 to 100) shows the speculators are currently Bearish with a score of 44.1 percent. The commercials are Bullish with a score of 56.2 percent and the small traders (not shown in chart) are Bearish with a score of 36.1 percent.
Free Reports:
 Sign Up for Our Stock Market Newsletter – Get updated on News, Charts & Rankings of Public Companies when you join our Stocks Newsletter
 Get our Weekly Commitment of Traders Reports - See where the biggest traders (Hedge Funds and Commercial Hedgers) are positioned in the futures markets on a weekly basis.
| VIX Volatility Futures Statistics | SPECULATORS | COMMERCIALS | SMALL TRADERS |
| – Percent of Open Interest Longs: | 15.9 | 57.9 | 5.5 |
| – Percent of Open Interest Shorts: | 43.1 | 29.2 | 7.0 |
| – Net Position: | -102,647 | 107,991 | -5,344 |
| – Gross Longs: | 60,072 | 218,252 | 20,902 |
| – Gross Shorts: | 162,719 | 110,261 | 26,246 |
| – Long to Short Ratio: | 0.4 to 1 | 2.0 to 1 | 0.8 to 1 |
| NET POSITION TREND: | |||
| – COT Index Score (3 Year Range Pct): | 44.1 | 56.2 | 36.1 |
| – COT Index Reading (3 Year Range): | Bearish | Bullish | Bearish |
| NET POSITION MOVEMENT INDEX: | |||
| – 6-Week Change in Strength Index: | 13.9 | -14.9 | 15.5 |
S&P500 Mini Futures Futures:
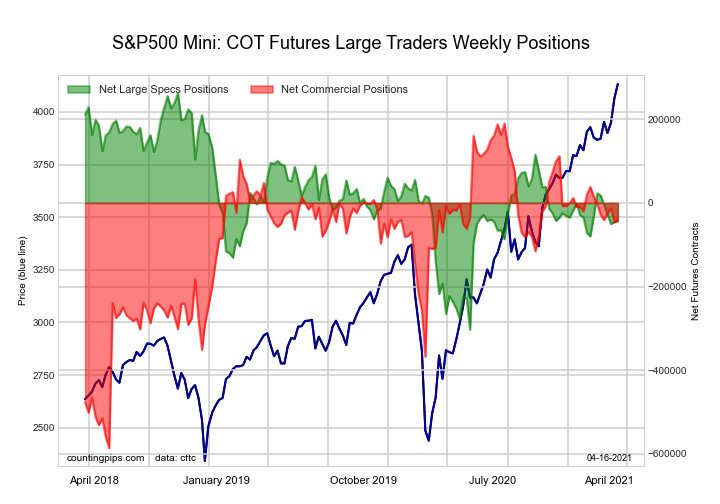
The S&P500 Mini Futures large speculator standing this week resulted in a net position of -40,096 contracts in the data reported through Tuesday. This was a weekly rise of 5,247 contracts from the previous week which had a total of -45,343 net contracts.
This week’s current strength score (the trader positioning range over the past three years, measured from 0 to 100) shows the speculators are currently Bearish with a score of 46.5 percent. The commercials are Bullish with a score of 69.9 percent and the small traders (not shown in chart) are Bearish with a score of 38.5 percent.
| S&P500 Mini Futures Statistics | SPECULATORS | COMMERCIALS | SMALL TRADERS |
| – Percent of Open Interest Longs: | 13.2 | 73.1 | 11.8 |
| – Percent of Open Interest Shorts: | 14.7 | 74.7 | 8.7 |
| – Net Position: | -40,096 | -43,177 | 83,273 |
| – Gross Longs: | 349,328 | 1,931,532 | 312,375 |
| – Gross Shorts: | 389,424 | 1,974,709 | 229,102 |
| – Long to Short Ratio: | 0.9 to 1 | 1.0 to 1 | 1.4 to 1 |
| NET POSITION TREND: | |||
| – COT Index Score (3 Year Range Pct): | 46.5 | 69.9 | 38.5 |
| – COT Index Reading (3 Year Range): | Bearish | Bullish | Bearish |
| NET POSITION MOVEMENT INDEX: | |||
| – 6-Week Change in Strength Index: | -11.2 | -5.2 | 19.2 |
Dow Jones Mini Futures Futures:
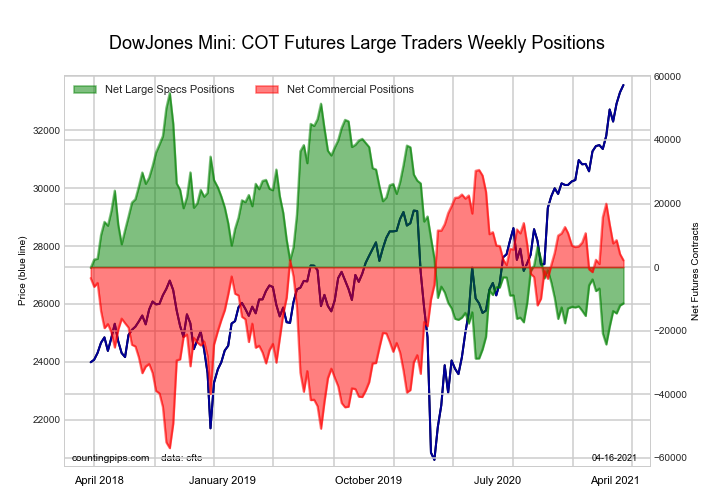
The Dow Jones Mini Futures large speculator standing this week resulted in a net position of -11,387 contracts in the data reported through Tuesday. This was a weekly advance of 668 contracts from the previous week which had a total of -12,055 net contracts.
This week’s current strength score (the trader positioning range over the past three years, measured from 0 to 100) shows the speculators are currently Bearish with a score of 20.8 percent. The commercials are Bullish with a score of 67.5 percent and the small traders (not shown in chart) are Bullish-Extreme with a score of 100.0 percent.
| Dow Jones Mini Futures Statistics | SPECULATORS | COMMERCIALS | SMALL TRADERS |
| – Percent of Open Interest Longs: | 29.4 | 44.7 | 22.9 |
| – Percent of Open Interest Shorts: | 41.7 | 42.4 | 12.9 |
| – Net Position: | -11,387 | 2,149 | 9,238 |
| – Gross Longs: | 27,072 | 41,181 | 21,145 |
| – Gross Shorts: | 38,459 | 39,032 | 11,907 |
| – Long to Short Ratio: | 0.7 to 1 | 1.1 to 1 | 1.8 to 1 |
| NET POSITION TREND: | |||
| – COT Index Score (3 Year Range Pct): | 20.8 | 67.5 | 100.0 |
| – COT Index Reading (3 Year Range): | Bearish | Bullish | Bullish-Extreme |
| NET POSITION MOVEMENT INDEX: | |||
| – 6-Week Change in Strength Index: | 11.3 | -15.5 | 25.0 |
Nasdaq Mini Futures Futures:
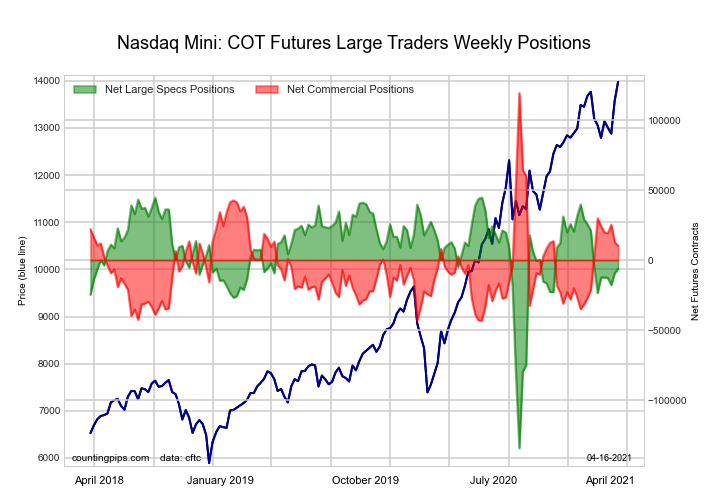
The Nasdaq Mini Futures large speculator standing this week resulted in a net position of -6,111 contracts in the data reported through Tuesday. This was a weekly increase of 3,285 contracts from the previous week which had a total of -9,396 net contracts.
This week’s current strength score (the trader positioning range over the past three years, measured from 0 to 100) shows the speculators are currently Bullish with a score of 71.6 percent. The commercials are Bearish with a score of 32.9 percent and the small traders (not shown in chart) are Bearish with a score of 34.4 percent.
| Nasdaq Mini Futures Statistics | SPECULATORS | COMMERCIALS | SMALL TRADERS |
| – Percent of Open Interest Longs: | 27.7 | 54.3 | 16.6 |
| – Percent of Open Interest Shorts: | 30.5 | 49.5 | 18.6 |
| – Net Position: | -6,111 | 10,372 | -4,261 |
| – Gross Longs: | 59,294 | 116,412 | 35,513 |
| – Gross Shorts: | 65,405 | 106,040 | 39,774 |
| – Long to Short Ratio: | 0.9 to 1 | 1.1 to 1 | 0.9 to 1 |
| NET POSITION TREND: | |||
| – COT Index Score (3 Year Range Pct): | 71.6 | 32.9 | 34.4 |
| – COT Index Reading (3 Year Range): | Bullish | Bearish | Bearish |
| NET POSITION MOVEMENT INDEX: | |||
| – 6-Week Change in Strength Index: | 9.7 | -12.0 | 4.6 |
Russell 2000 Mini Futures Futures:
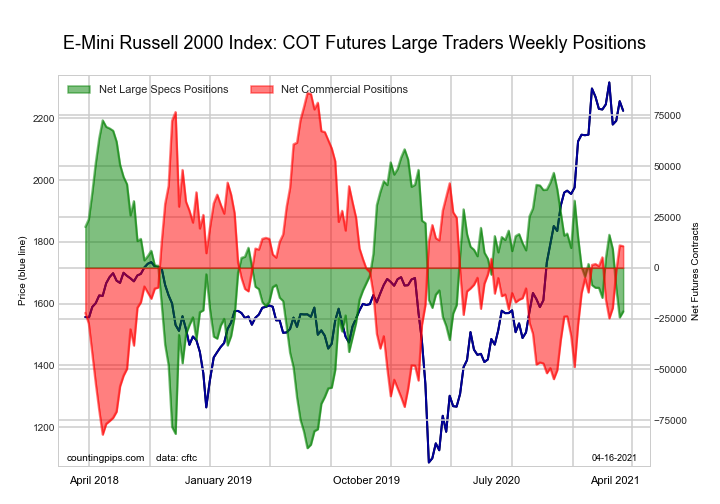
The Russell 2000 Mini Futures large speculator standing this week resulted in a net position of -21,461 contracts in the data reported through Tuesday. This was a weekly lift of 2,937 contracts from the previous week which had a total of -24,398 net contracts.
This week’s current strength score (the trader positioning range over the past three years, measured from 0 to 100) shows the speculators are currently Bearish with a score of 41.7 percent. The commercials are Bullish with a score of 55.2 percent and the small traders (not shown in chart) are Bullish with a score of 63.6 percent.
| Russell 2000 Mini Futures Statistics | SPECULATORS | COMMERCIALS | SMALL TRADERS |
| – Percent of Open Interest Longs: | 12.5 | 80.6 | 6.5 |
| – Percent of Open Interest Shorts: | 17.2 | 78.3 | 4.2 |
| – Net Position: | -21,461 | 10,627 | 10,834 |
| – Gross Longs: | 57,922 | 371,929 | 30,083 |
| – Gross Shorts: | 79,383 | 361,302 | 19,249 |
| – Long to Short Ratio: | 0.7 to 1 | 1.0 to 1 | 1.6 to 1 |
| NET POSITION TREND: | |||
| – COT Index Score (3 Year Range Pct): | 41.7 | 55.2 | 63.6 |
| – COT Index Reading (3 Year Range): | Bearish | Bullish | Bullish |
| NET POSITION MOVEMENT INDEX: | |||
| – 6-Week Change in Strength Index: | -4.2 | 3.2 | 3.5 |
Nikkei Stock Average (USD) Futures Futures:
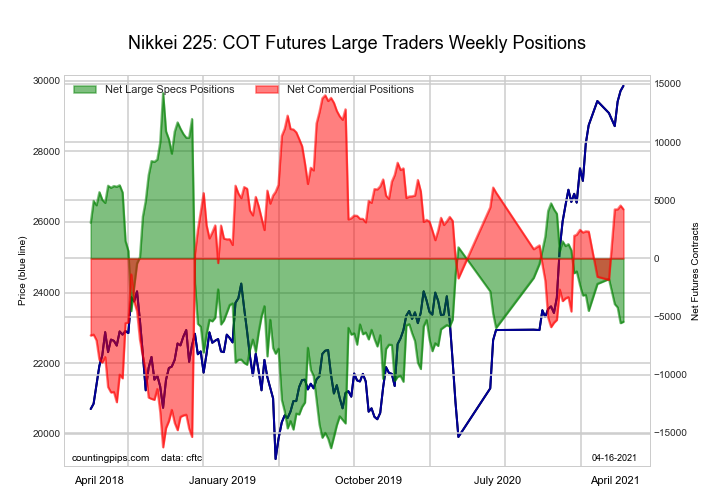
The Nikkei Stock Average (USD) Futures large speculator standing this week resulted in a net position of -5,436 contracts in the data reported through Tuesday. This was a weekly increase of 117 contracts from the previous week which had a total of -5,553 net contracts.
This week’s current strength score (the trader positioning range over the past three years, measured from 0 to 100) shows the speculators are currently Bearish with a score of 35.6 percent. The commercials are Bullish with a score of 67.6 percent and the small traders (not shown in chart) are Bearish with a score of 32.9 percent.
| Nikkei Stock Average Futures Statistics | SPECULATORS | COMMERCIALS | SMALL TRADERS |
| – Percent of Open Interest Longs: | 10.8 | 54.7 | 34.5 |
| – Percent of Open Interest Shorts: | 47.9 | 25.9 | 26.2 |
| – Net Position: | -5,436 | 4,222 | 1,214 |
| – Gross Longs: | 1,582 | 8,010 | 5,048 |
| – Gross Shorts: | 7,018 | 3,788 | 3,834 |
| – Long to Short Ratio: | 0.2 to 1 | 2.1 to 1 | 1.3 to 1 |
| NET POSITION TREND: | |||
| – COT Index Score (3 Year Range Pct): | 35.6 | 67.6 | 32.9 |
| – COT Index Reading (3 Year Range): | Bearish | Bullish | Bearish |
| NET POSITION MOVEMENT INDEX: | |||
| – 6-Week Change in Strength Index: | -3.1 | 6.3 | -11.5 |
MSCI EAFE Mini Futures Futures:
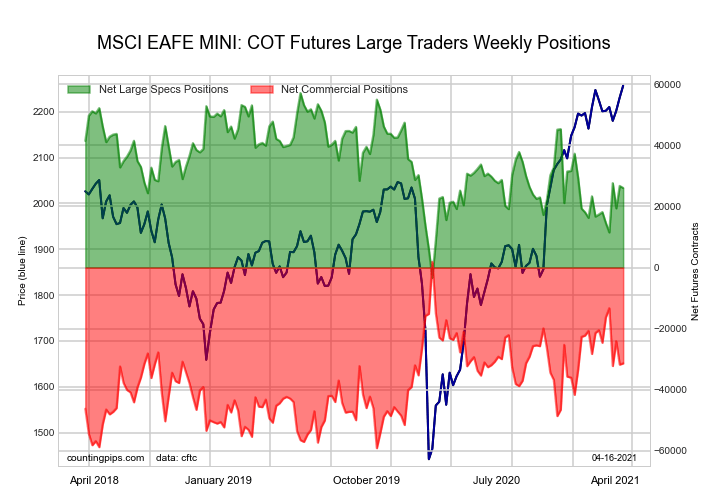
The MSCI EAFE Mini Futures large speculator standing this week resulted in a net position of 26,070 contracts in the data reported through Tuesday. This was a weekly lowering of -661 contracts from the previous week which had a total of 26,731 net contracts.
This week’s current strength score (the trader positioning range over the past three years, measured from 0 to 100) shows the speculators are currently Bearish with a score of 48.6 percent. The commercials are Bearish with a score of 45.5 percent and the small traders (not shown in chart) are Bullish with a score of 64.4 percent.
| MSCI EAFE Mini Futures Statistics | SPECULATORS | COMMERCIALS | SMALL TRADERS |
| – Percent of Open Interest Longs: | 9.4 | 88.1 | 2.3 |
| – Percent of Open Interest Shorts: | 2.9 | 95.8 | 1.0 |
| – Net Position: | 26,070 | -31,415 | 5,345 |
| – Gross Longs: | 38,024 | 357,848 | 9,517 |
| – Gross Shorts: | 11,954 | 389,263 | 4,172 |
| – Long to Short Ratio: | 3.2 to 1 | 0.9 to 1 | 2.3 to 1 |
| NET POSITION TREND: | |||
| – COT Index Score (3 Year Range Pct): | 48.6 | 45.5 | 64.4 |
| – COT Index Reading (3 Year Range): | Bearish | Bearish | Bullish |
| NET POSITION MOVEMENT INDEX: | |||
| – 6-Week Change in Strength Index: | 13.0 | -11.1 | -10.3 |
MSCI Emerging Mkts Mini Futures Futures:
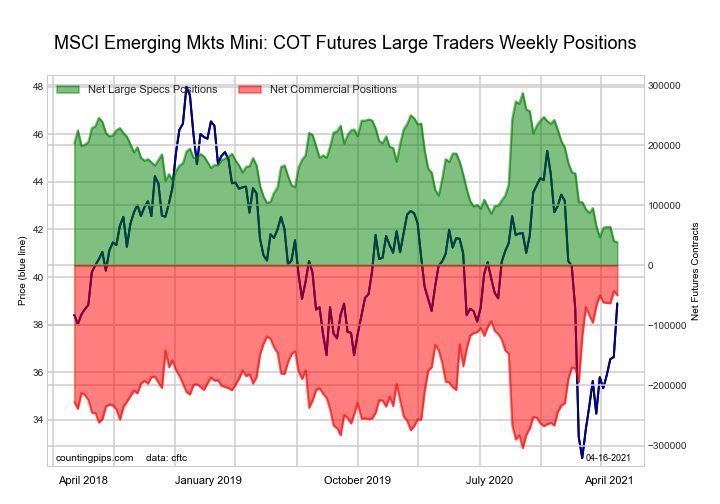
The MSCI Emerging Mkts Mini Futures large speculator standing this week resulted in a net position of 38,211 contracts in the data reported through Tuesday. This was a weekly fall of -2,219 contracts from the previous week which had a total of 40,430 net contracts.
This week’s current strength score (the trader positioning range over the past three years, measured from 0 to 100) shows the speculators are currently Bearish-Extreme with a score of 0.0 percent. The commercials are Bullish-Extreme with a score of 97.2 percent and the small traders (not shown in chart) are Bearish with a score of 40.4 percent.
| MSCI Emerging Mkts Mini Futures Statistics | SPECULATORS | COMMERCIALS | SMALL TRADERS |
| – Percent of Open Interest Longs: | 14.3 | 82.2 | 2.4 |
| – Percent of Open Interest Shorts: | 11.0 | 86.5 | 1.3 |
| – Net Position: | 38,211 | -49,886 | 11,675 |
| – Gross Longs: | 165,150 | 950,685 | 27,250 |
| – Gross Shorts: | 126,939 | 1,000,571 | 15,575 |
| – Long to Short Ratio: | 1.3 to 1 | 1.0 to 1 | 1.7 to 1 |
| NET POSITION TREND: | |||
| – COT Index Score (3 Year Range Pct): | 0.0 | 97.2 | 40.4 |
| – COT Index Reading (3 Year Range): | Bearish-Extreme | Bullish-Extreme | Bearish |
| NET POSITION MOVEMENT INDEX: | |||
| – 6-Week Change in Strength Index: | -11.0 | 6.8 | 7.3 |
Article By CountingPips.com – Receive our weekly COT Reports by Email
*COT Report: The COT data, released weekly to the public each Friday, is updated through the most recent Tuesday (data is 3 days old) and shows a quick view of how large speculators or non-commercials (for-profit traders) were positioned in the futures markets.
The CFTC categorizes trader positions according to commercial hedgers (traders who use futures contracts for hedging as part of the business), non-commercials (large traders who speculate to realize trading profits) and nonreportable traders (usually small traders/speculators).
Find CFTC criteria here: (http://www.cftc.gov/MarketReports/CommitmentsofTraders/ExplanatoryNotes/index.htm).

- 3 Signs of Developing U.S. Economic Slowdown Apr 19, 2024
- Israel has retaliated against Iran. Investors run to safe assets Apr 19, 2024
- Gold hits record high amid growing geopolitical tensions Apr 19, 2024
- The US natural gas prices fell to a 2-month low. A drop in the technology sector on Wednesday had a negative impact on the broad market Apr 18, 2024
- Target Thursdays: Cocoa, Bitcoin and USDCHF hit targets! Apr 18, 2024
- British Pound shows signs of recovery amid favourable inflation data Apr 18, 2024
- Indices decline amid hawkish comments from the Fed. Investors are waiting for Israel’s answer Apr 17, 2024
- EURGBP: Slams into support on hot UK inflation Apr 17, 2024
- Brent crude prices dip amid concerns over global demand Apr 17, 2024
- Stock indices sell-off amid rising geopolitical tensions in the Middle East. China’s GDP grew the most in a year Apr 16, 2024