
By CountingPips.com – Receive our weekly COT Reports by Email
Here are the latest charts and statistics for the Commitment of Traders (COT) data published by the Commodities Futures Trading Commission (CFTC).
The latest COT data is updated through Tuesday April 06 2021 and shows a quick view of how large traders (for-profit speculators and commercial entities) were positioned in the futures markets.
CORN Futures:
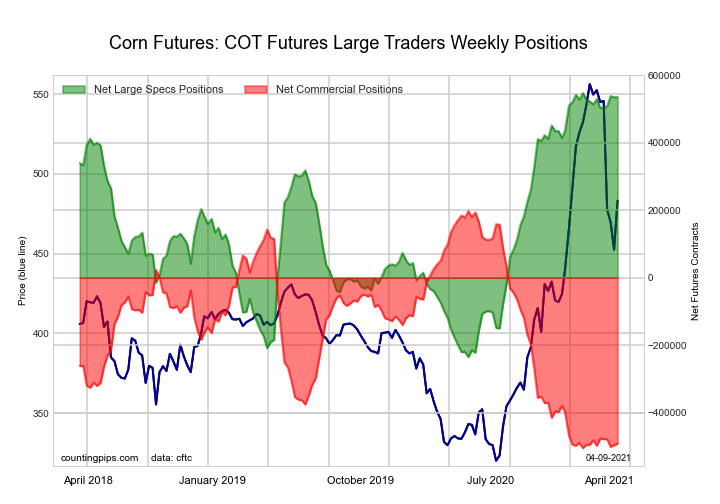
The CORN large speculator standing this week totaled a net position of 536,152 contracts in the data reported through Tuesday. This was a weekly gain of 807 contracts from the previous week which had a total of 535,345 net contracts.
This week’s current strength score (the trader positioning range over the past three years, measured from 0 to 100) shows the speculators are currently Bullish-Extreme with a score of 98.5 percent. The commercials are Bearish-Extreme with a score of 1.9 percent and the small traders (not shown in chart) are Bearish with a score of 22.7 percent.
| CORN Futures Statistics | SPECULATORS | COMMERCIALS | SMALL TRADERS |
| – Percent of Open Interest Longs: | 34.5 | 45.0 | 8.2 |
| – Percent of Open Interest Shorts: | 4.1 | 72.9 | 10.7 |
| – Net Position: | 536,152 | -491,962 | -44,190 |
| – Gross Longs: | 608,489 | 794,377 | 145,283 |
| – Gross Shorts: | 72,337 | 1,286,339 | 189,473 |
| – Long to Short Ratio: | 8.4 to 1 | 0.6 to 1 | 0.8 to 1 |
| NET POSITION TREND: | |||
| – COT Index Score (3 Year Range Pct): | 98.5 | 1.9 | 22.7 |
| – COT Index Reading (3 Year Range): | Bullish-Extreme | Bearish-Extreme | Bearish |
| NET POSITION MOVEMENT INDEX: | |||
| – 6-Week Change in Strength Index: | 0.8 | 0.8 | -6.5 |
Free Reports:
 Get our Weekly Commitment of Traders Reports - See where the biggest traders (Hedge Funds and Commercial Hedgers) are positioned in the futures markets on a weekly basis.
 Sign Up for Our Stock Market Newsletter – Get updated on News, Charts & Rankings of Public Companies when you join our Stocks Newsletter
SUGAR Futures:

The SUGAR large speculator standing this week totaled a net position of 183,005 contracts in the data reported through Tuesday. This was a weekly reduction of -7,164 contracts from the previous week which had a total of 190,169 net contracts.
This week’s current strength score (the trader positioning range over the past three years, measured from 0 to 100) shows the speculators are currently Bullish with a score of 74.2 percent. The commercials are Bearish with a score of 24.9 percent and the small traders (not shown in chart) are Bullish with a score of 63.9 percent.
| SUGAR Futures Statistics | SPECULATORS | COMMERCIALS | SMALL TRADERS |
| – Percent of Open Interest Longs: | 23.1 | 54.5 | 9.4 |
| – Percent of Open Interest Shorts: | 5.6 | 76.3 | 5.0 |
| – Net Position: | 183,005 | -228,329 | 45,324 |
| – Gross Longs: | 241,563 | 568,500 | 97,651 |
| – Gross Shorts: | 58,558 | 796,829 | 52,327 |
| – Long to Short Ratio: | 4.1 to 1 | 0.7 to 1 | 1.9 to 1 |
| NET POSITION TREND: | |||
| – COT Index Score (3 Year Range Pct): | 74.2 | 24.9 | 63.9 |
| – COT Index Reading (3 Year Range): | Bullish | Bearish | Bullish |
| NET POSITION MOVEMENT INDEX: | |||
| – 6-Week Change in Strength Index: | -11.3 | 15.9 | -36.1 |
COFFEE Futures:
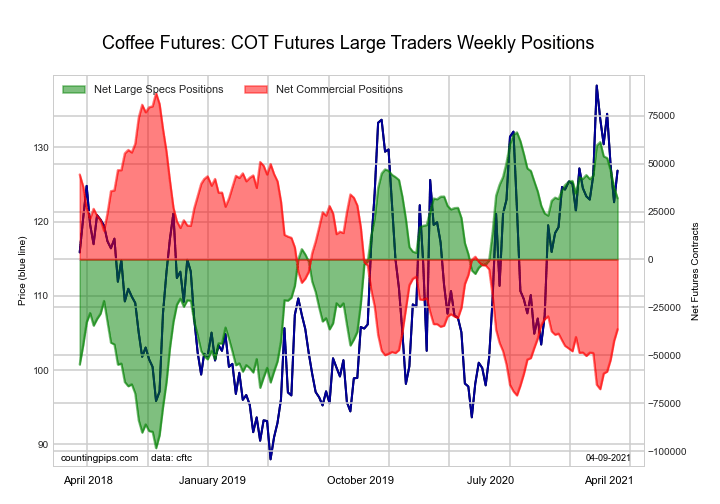
The COFFEE large speculator standing this week totaled a net position of 31,904 contracts in the data reported through Tuesday. This was a weekly fall of -5,713 contracts from the previous week which had a total of 37,617 net contracts.
This week’s current strength score (the trader positioning range over the past three years, measured from 0 to 100) shows the speculators are currently Bullish with a score of 79.1 percent. The commercials are Bearish with a score of 21.9 percent and the small traders (not shown in chart) are Bearish-Extreme with a score of 19.5 percent.
| COFFEE Futures Statistics | SPECULATORS | COMMERCIALS | SMALL TRADERS |
| – Percent of Open Interest Longs: | 23.4 | 49.5 | 4.2 |
| – Percent of Open Interest Shorts: | 12.3 | 62.1 | 2.7 |
| – Net Position: | 31,904 | -36,408 | 4,504 |
| – Gross Longs: | 67,634 | 143,349 | 12,223 |
| – Gross Shorts: | 35,730 | 179,757 | 7,719 |
| – Long to Short Ratio: | 1.9 to 1 | 0.8 to 1 | 1.6 to 1 |
| NET POSITION TREND: | |||
| – COT Index Score (3 Year Range Pct): | 79.1 | 21.9 | 19.5 |
| – COT Index Reading (3 Year Range): | Bullish | Bearish | Bearish-Extreme |
| NET POSITION MOVEMENT INDEX: | |||
| – 6-Week Change in Strength Index: | -16.7 | 18.3 | -9.6 |
SOYBEANS Futures:
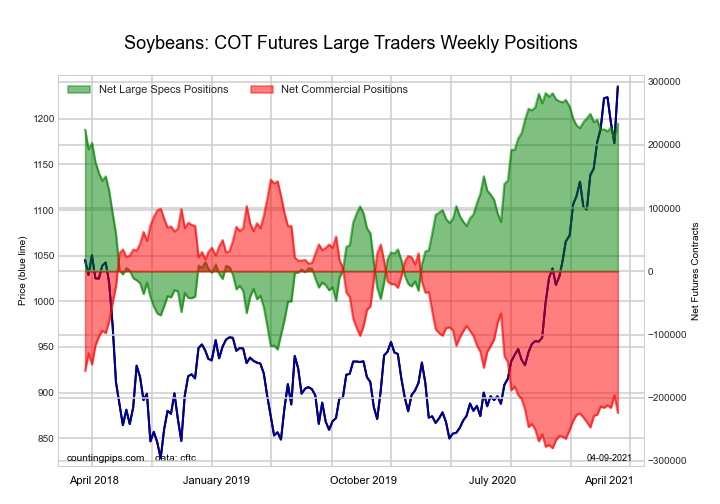
The SOYBEANS large speculator standing this week totaled a net position of 233,803 contracts in the data reported through Tuesday. This was a weekly boost of 22,124 contracts from the previous week which had a total of 211,679 net contracts.
This week’s current strength score (the trader positioning range over the past three years, measured from 0 to 100) shows the speculators are currently Bullish-Extreme with a score of 88.1 percent. The commercials are Bearish-Extreme with a score of 13.1 percent and the small traders (not shown in chart) are Bullish with a score of 68.0 percent.
| SOYBEANS Futures Statistics | SPECULATORS | COMMERCIALS | SMALL TRADERS |
| – Percent of Open Interest Longs: | 31.8 | 45.3 | 7.7 |
| – Percent of Open Interest Shorts: | 5.0 | 71.1 | 8.8 |
| – Net Position: | 233,803 | -224,010 | -9,793 |
| – Gross Longs: | 276,934 | 394,408 | 66,733 |
| – Gross Shorts: | 43,131 | 618,418 | 76,526 |
| – Long to Short Ratio: | 6.4 to 1 | 0.6 to 1 | 0.9 to 1 |
| NET POSITION TREND: | |||
| – COT Index Score (3 Year Range Pct): | 88.1 | 13.1 | 68.0 |
| – COT Index Reading (3 Year Range): | Bullish-Extreme | Bearish-Extreme | Bullish |
| NET POSITION MOVEMENT INDEX: | |||
| – 6-Week Change in Strength Index: | -1.5 | 0.6 | 3.9 |
SOYBEAN OIL Futures:

The SOYBEAN OIL large speculator standing this week totaled a net position of 94,703 contracts in the data reported through Tuesday. This was a weekly fall of -5,688 contracts from the previous week which had a total of 100,391 net contracts.
This week’s current strength score (the trader positioning range over the past three years, measured from 0 to 100) shows the speculators are currently Bullish with a score of 78.0 percent. The commercials are Bearish with a score of 20.7 percent and the small traders (not shown in chart) are Bullish-Extreme with a score of 81.4 percent.
| SOYBEAN OIL Futures Statistics | SPECULATORS | COMMERCIALS | SMALL TRADERS |
| – Percent of Open Interest Longs: | 27.5 | 47.1 | 9.1 |
| – Percent of Open Interest Shorts: | 8.4 | 69.8 | 5.4 |
| – Net Position: | 94,703 | -112,924 | 18,221 |
| – Gross Longs: | 136,684 | 233,926 | 45,209 |
| – Gross Shorts: | 41,981 | 346,850 | 26,988 |
| – Long to Short Ratio: | 3.3 to 1 | 0.7 to 1 | 1.7 to 1 |
| NET POSITION TREND: | |||
| – COT Index Score (3 Year Range Pct): | 78.0 | 20.7 | 81.4 |
| – COT Index Reading (3 Year Range): | Bullish | Bearish | Bullish-Extreme |
| NET POSITION MOVEMENT INDEX: | |||
| – 6-Week Change in Strength Index: | -16.3 | 16.4 | -8.9 |
SOYBEAN MEAL Futures:
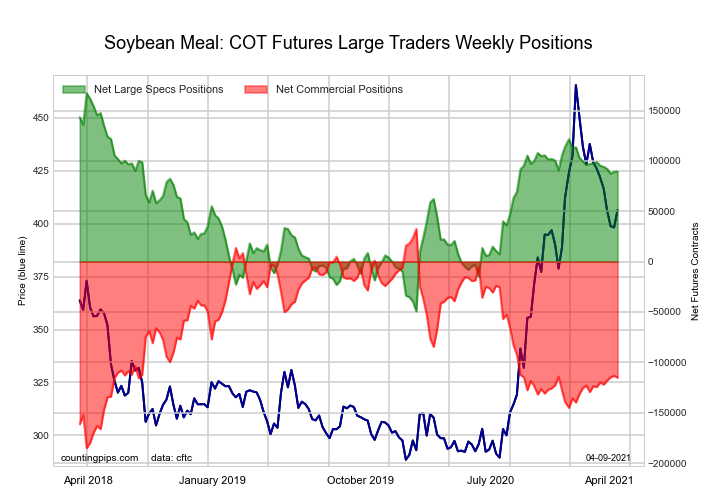
The SOYBEAN MEAL large speculator standing this week totaled a net position of 89,453 contracts in the data reported through Tuesday. This was a weekly lift of 125 contracts from the previous week which had a total of 89,328 net contracts.
This week’s current strength score (the trader positioning range over the past three years, measured from 0 to 100) shows the speculators are currently Bullish with a score of 64.0 percent. The commercials are Bearish with a score of 32.2 percent and the small traders (not shown in chart) are Bullish with a score of 73.7 percent.
| SOYBEAN MEAL Futures Statistics | SPECULATORS | COMMERCIALS | SMALL TRADERS |
| – Percent of Open Interest Longs: | 24.8 | 49.1 | 12.9 |
| – Percent of Open Interest Shorts: | 3.3 | 76.8 | 6.7 |
| – Net Position: | 89,453 | -115,178 | 25,725 |
| – Gross Longs: | 103,009 | 203,511 | 53,489 |
| – Gross Shorts: | 13,556 | 318,689 | 27,764 |
| – Long to Short Ratio: | 7.6 to 1 | 0.6 to 1 | 1.9 to 1 |
| NET POSITION TREND: | |||
| – COT Index Score (3 Year Range Pct): | 64.0 | 32.2 | 73.7 |
| – COT Index Reading (3 Year Range): | Bullish | Bearish | Bullish |
| NET POSITION MOVEMENT INDEX: | |||
| – 6-Week Change in Strength Index: | -4.3 | 4.3 | 0.0 |
LIVE CATTLE Futures:
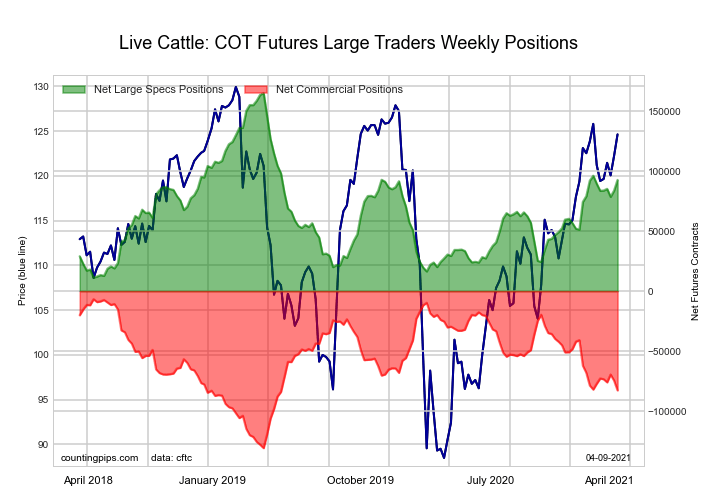
The LIVE CATTLE large speculator standing this week totaled a net position of 92,683 contracts in the data reported through Tuesday. This was a weekly gain of 8,827 contracts from the previous week which had a total of 83,856 net contracts.
This week’s current strength score (the trader positioning range over the past three years, measured from 0 to 100) shows the speculators are currently Bullish with a score of 52.9 percent. The commercials are Bearish with a score of 38.8 percent and the small traders (not shown in chart) are Bullish with a score of 62.8 percent.
| LIVE CATTLE Futures Statistics | SPECULATORS | COMMERCIALS | SMALL TRADERS |
| – Percent of Open Interest Longs: | 39.1 | 35.8 | 9.6 |
| – Percent of Open Interest Shorts: | 12.1 | 59.9 | 12.5 |
| – Net Position: | 92,683 | -82,699 | -9,984 |
| – Gross Longs: | 134,251 | 123,138 | 33,149 |
| – Gross Shorts: | 41,568 | 205,837 | 43,133 |
| – Long to Short Ratio: | 3.2 to 1 | 0.6 to 1 | 0.8 to 1 |
| NET POSITION TREND: | |||
| – COT Index Score (3 Year Range Pct): | 52.9 | 38.8 | 62.8 |
| – COT Index Reading (3 Year Range): | Bullish | Bearish | Bullish |
| NET POSITION MOVEMENT INDEX: | |||
| – 6-Week Change in Strength Index: | 2.1 | -4.5 | 5.8 |
LEAN HOGS Futures:
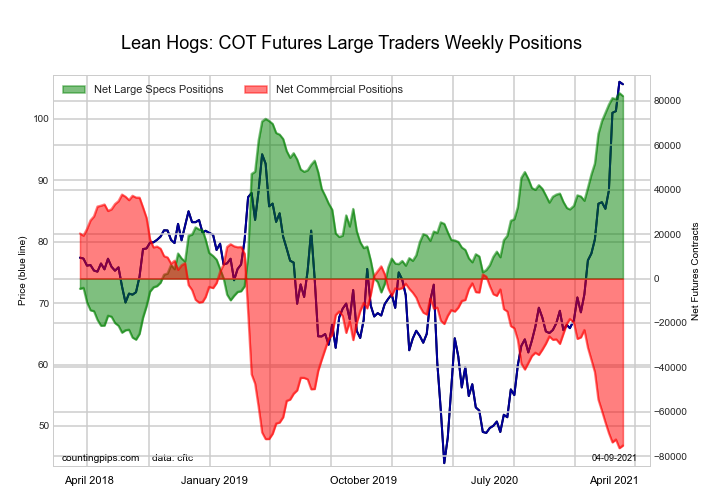
The LEAN HOGS large speculator standing this week totaled a net position of 82,207 contracts in the data reported through Tuesday. This was a weekly decline of -1,344 contracts from the previous week which had a total of 83,551 net contracts.
This week’s current strength score (the trader positioning range over the past three years, measured from 0 to 100) shows the speculators are currently Bullish-Extreme with a score of 98.8 percent. The commercials are Bearish-Extreme with a score of 1.0 percent and the small traders (not shown in chart) are Bearish with a score of 44.4 percent.
| LEAN HOGS Futures Statistics | SPECULATORS | COMMERCIALS | SMALL TRADERS |
| – Percent of Open Interest Longs: | 42.0 | 29.6 | 9.3 |
| – Percent of Open Interest Shorts: | 13.6 | 55.5 | 11.7 |
| – Net Position: | 82,207 | -75,178 | -7,029 |
| – Gross Longs: | 121,642 | 85,686 | 26,899 |
| – Gross Shorts: | 39,435 | 160,864 | 33,928 |
| – Long to Short Ratio: | 3.1 to 1 | 0.5 to 1 | 0.8 to 1 |
| NET POSITION TREND: | |||
| – COT Index Score (3 Year Range Pct): | 98.8 | 1.0 | 44.4 |
| – COT Index Reading (3 Year Range): | Bullish-Extreme | Bearish-Extreme | Bearish |
| NET POSITION MOVEMENT INDEX: | |||
| – 6-Week Change in Strength Index: | 10.2 | -13.7 | 20.6 |
COTTON Futures:

The COTTON large speculator standing this week totaled a net position of 74,388 contracts in the data reported through Tuesday. This was a weekly decline of -2,263 contracts from the previous week which had a total of 76,651 net contracts.
This week’s current strength score (the trader positioning range over the past three years, measured from 0 to 100) shows the speculators are currently Bullish with a score of 67.9 percent. The commercials are Bearish with a score of 32.0 percent and the small traders (not shown in chart) are Bullish with a score of 60.8 percent.
| COTTON Futures Statistics | SPECULATORS | COMMERCIALS | SMALL TRADERS |
| – Percent of Open Interest Longs: | 37.4 | 41.0 | 7.0 |
| – Percent of Open Interest Shorts: | 5.0 | 77.0 | 3.4 |
| – Net Position: | 74,388 | -82,644 | 8,256 |
| – Gross Longs: | 85,822 | 94,112 | 16,044 |
| – Gross Shorts: | 11,434 | 176,756 | 7,788 |
| – Long to Short Ratio: | 7.5 to 1 | 0.5 to 1 | 2.1 to 1 |
| NET POSITION TREND: | |||
| – COT Index Score (3 Year Range Pct): | 67.9 | 32.0 | 60.8 |
| – COT Index Reading (3 Year Range): | Bullish | Bearish | Bullish |
| NET POSITION MOVEMENT INDEX: | |||
| – 6-Week Change in Strength Index: | -14.0 | 15.5 | -27.8 |
COCOA Futures:
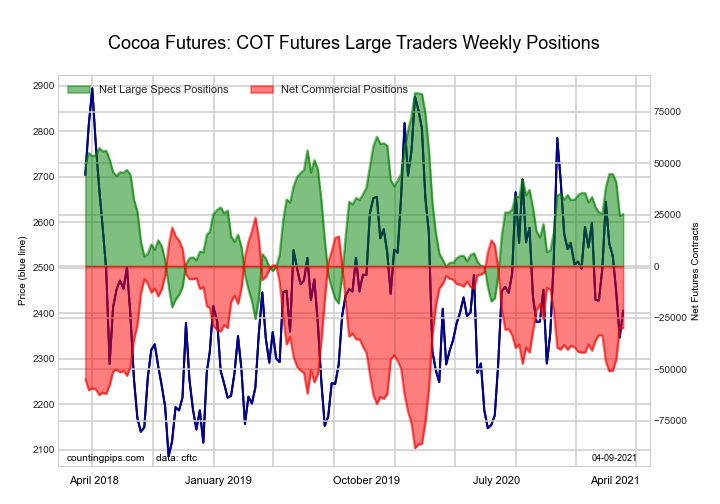
The COCOA large speculator standing this week totaled a net position of 25,372 contracts in the data reported through Tuesday. This was a weekly boost of 874 contracts from the previous week which had a total of 24,498 net contracts.
This week’s current strength score (the trader positioning range over the past three years, measured from 0 to 100) shows the speculators are currently Bearish with a score of 46.5 percent. The commercials are Bullish with a score of 52.1 percent and the small traders (not shown in chart) are Bullish with a score of 60.8 percent.
| COCOA Futures Statistics | SPECULATORS | COMMERCIALS | SMALL TRADERS |
| – Percent of Open Interest Longs: | 29.8 | 47.1 | 6.1 |
| – Percent of Open Interest Shorts: | 16.4 | 63.0 | 3.7 |
| – Net Position: | 25,372 | -29,976 | 4,604 |
| – Gross Longs: | 56,360 | 89,122 | 11,585 |
| – Gross Shorts: | 30,988 | 119,098 | 6,981 |
| – Long to Short Ratio: | 1.8 to 1 | 0.7 to 1 | 1.7 to 1 |
| NET POSITION TREND: | |||
| – COT Index Score (3 Year Range Pct): | 46.5 | 52.1 | 60.8 |
| – COT Index Reading (3 Year Range): | Bearish | Bullish | Bullish |
| NET POSITION MOVEMENT INDEX: | |||
| – 6-Week Change in Strength Index: | -0.2 | 3.2 | -38.1 |
WHEAT Futures:
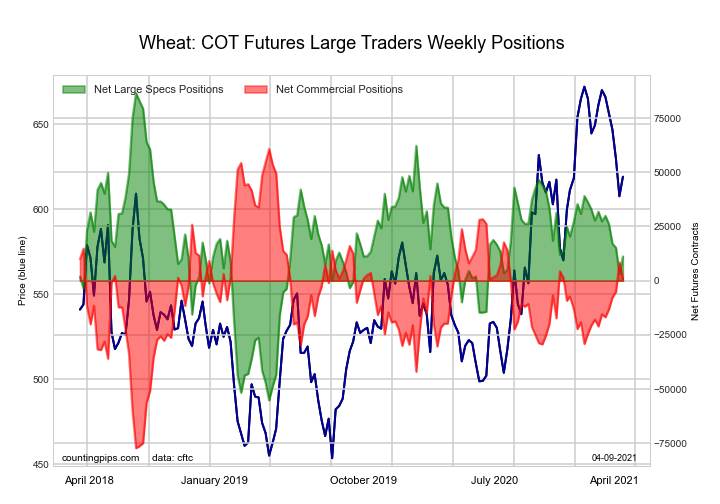
The WHEAT large speculator standing this week totaled a net position of 11,204 contracts in the data reported through Tuesday. This was a weekly increase of 8,120 contracts from the previous week which had a total of 3,084 net contracts.
This week’s current strength score (the trader positioning range over the past three years, measured from 0 to 100) shows the speculators are currently Bearish with a score of 46.8 percent. The commercials are Bullish with a score of 56.5 percent and the small traders (not shown in chart) are Bearish with a score of 44.1 percent.
| WHEAT Futures Statistics | SPECULATORS | COMMERCIALS | SMALL TRADERS |
| – Percent of Open Interest Longs: | 29.2 | 36.7 | 7.4 |
| – Percent of Open Interest Shorts: | 26.5 | 36.5 | 10.3 |
| – Net Position: | 11,204 | 828 | -12,032 |
| – Gross Longs: | 120,515 | 151,697 | 30,431 |
| – Gross Shorts: | 109,311 | 150,869 | 42,463 |
| – Long to Short Ratio: | 1.1 to 1 | 1.0 to 1 | 0.7 to 1 |
| NET POSITION TREND: | |||
| – COT Index Score (3 Year Range Pct): | 46.8 | 56.5 | 44.1 |
| – COT Index Reading (3 Year Range): | Bearish | Bullish | Bearish |
| NET POSITION MOVEMENT INDEX: | |||
| – 6-Week Change in Strength Index: | -11.4 | 11.8 | -0.4 |
Article By CountingPips.com – Receive our weekly COT Reports by Email
*COT Report: The COT data, released weekly to the public each Friday, is updated through the most recent Tuesday (data is 3 days old) and shows a quick view of how large speculators or non-commercials (for-profit traders) were positioned in the futures markets.
The CFTC categorizes trader positions according to commercial hedgers (traders who use futures contracts for hedging as part of the business), non-commercials (large traders who speculate to realize trading profits) and nonreportable traders (usually small traders/speculators).
Find CFTC criteria here: (http://www.cftc.gov/MarketReports/CommitmentsofTraders/ExplanatoryNotes/index.htm).

- TSLA shares rose on a weak report. Inflationary pressures are easing in Australia Apr 24, 2024
- USDJPY: On intervention watch Apr 24, 2024
- Euro gains against the dollar amid mixed economic signals Apr 24, 2024
- PMI data is the focus of investors’ attention today. Turkey, Iraq, Qatar, and UAE signed a transportation agreement Apr 23, 2024
- Australian dollar rises on strong economic indicators Apr 23, 2024
- Geopolitical risks in the Middle East are declining. China kept interest rates at lows Apr 22, 2024
- Brent crude dips to four-week low amid easing geopolitical tensions Apr 22, 2024
- COT Metals Charts: Speculator bets led by Copper & Silver Apr 20, 2024
- COT Bonds Charts: Speculator bets led by 10-Year Bonds & Fed Funds Apr 20, 2024
- COT Stock Market Charts: Speculator bets led by S&P500-Mini Apr 20, 2024