
By CountingPips.com – Receive our weekly COT Reports by Email
Here are the latest charts and statistics for the Commitment of Traders (COT) data published by the Commodities Futures Trading Commission (CFTC).
The latest COT data is updated through Tuesday April 06 2021 and shows a quick view of how large traders (for-profit speculators and commercial entities) were positioned in the futures markets.
30-Day Federal Funds Futures:
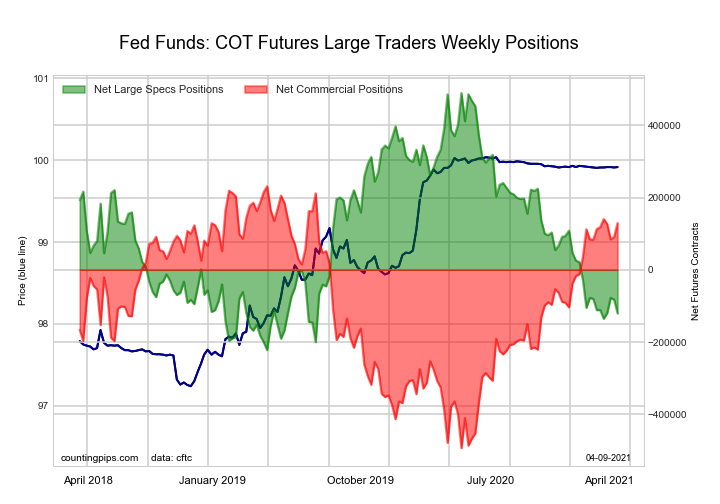
The 30-Day Federal Funds large speculator standing this week recorded a net position of -120,673 contracts in the data reported through Tuesday. This was a weekly fall of -38,042 contracts from the previous week which had a total of -82,631 net contracts.
This week’s current strength score (the trader positioning range over the past three years, measured from 0 to 100) shows the speculators are currently Bearish-Extreme with a score of 14.3 percent. The commercials are Bullish-Extreme with a score of 86.0 percent and the small traders (not shown in chart) are Bullish with a score of 55.3 percent.
Free Reports:
 Sign Up for Our Stock Market Newsletter – Get updated on News, Charts & Rankings of Public Companies when you join our Stocks Newsletter
 Get our Weekly Commitment of Traders Reports - See where the biggest traders (Hedge Funds and Commercial Hedgers) are positioned in the futures markets on a weekly basis.
| 30-Day Federal Funds Statistics | SPECULATORS | COMMERCIALS | SMALL TRADERS |
| – Percent of Open Interest Longs: | 8.3 | 70.5 | 2.2 |
| – Percent of Open Interest Shorts: | 20.3 | 57.7 | 3.0 |
| – Net Position: | -120,673 | 129,362 | -8,689 |
| – Gross Longs: | 84,005 | 711,313 | 21,909 |
| – Gross Shorts: | 204,678 | 581,951 | 30,598 |
| – Long to Short Ratio: | 0.4 to 1 | 1.2 to 1 | 0.7 to 1 |
| NET POSITION TREND: | |||
| – COT Index Score (3 Year Range Pct): | 14.3 | 86.0 | 55.3 |
| – COT Index Reading (3 Year Range): | Bearish-Extreme | Bullish-Extreme | Bullish |
| NET POSITION MOVEMENT INDEX: | |||
| – 6-Week Change in Strength Index: | -1.3 | 2.3 | -13.4 |
2-Year Treasury Note Futures:

The 2-Year Treasury Note large speculator standing this week recorded a net position of -375,820 contracts in the data reported through Tuesday. This was a weekly lowering of -29,128 contracts from the previous week which had a total of -346,692 net contracts.
This week’s current strength score (the trader positioning range over the past three years, measured from 0 to 100) shows the speculators are currently Bearish-Extreme with a score of 8.6 percent. The commercials are Bullish-Extreme with a score of 85.7 percent and the small traders (not shown in chart) are Bearish with a score of 46.0 percent.
| 2-Year Treasury Note Statistics | SPECULATORS | COMMERCIALS | SMALL TRADERS |
| – Percent of Open Interest Longs: | 16.9 | 75.9 | 6.2 |
| – Percent of Open Interest Shorts: | 33.2 | 60.6 | 5.3 |
| – Net Position: | -375,820 | 354,777 | 21,043 |
| – Gross Longs: | 390,901 | 1,754,671 | 142,678 |
| – Gross Shorts: | 766,721 | 1,399,894 | 121,635 |
| – Long to Short Ratio: | 0.5 to 1 | 1.3 to 1 | 1.2 to 1 |
| NET POSITION TREND: | |||
| – COT Index Score (3 Year Range Pct): | 8.6 | 85.7 | 46.0 |
| – COT Index Reading (3 Year Range): | Bearish-Extreme | Bullish-Extreme | Bearish |
| NET POSITION MOVEMENT INDEX: | |||
| – 6-Week Change in Strength Index: | -70.0 | 73.9 | -25.6 |
5-Year Treasury Note Futures:

The 5-Year Treasury Note large speculator standing this week recorded a net position of -7,617 contracts in the data reported through Tuesday. This was a weekly lowering of -102,952 contracts from the previous week which had a total of 95,335 net contracts.
This week’s current strength score (the trader positioning range over the past three years, measured from 0 to 100) shows the speculators are currently Bullish-Extreme with a score of 89.3 percent. The commercials are Bearish with a score of 22.3 percent and the small traders (not shown in chart) are Bearish with a score of 21.4 percent.
| 5-Year Treasury Note Statistics | SPECULATORS | COMMERCIALS | SMALL TRADERS |
| – Percent of Open Interest Longs: | 13.6 | 76.3 | 7.6 |
| – Percent of Open Interest Shorts: | 13.8 | 72.3 | 11.3 |
| – Net Position: | -7,617 | 141,544 | -133,927 |
| – Gross Longs: | 485,239 | 2,727,948 | 271,735 |
| – Gross Shorts: | 492,856 | 2,586,404 | 405,662 |
| – Long to Short Ratio: | 1.0 to 1 | 1.1 to 1 | 0.7 to 1 |
| NET POSITION TREND: | |||
| – COT Index Score (3 Year Range Pct): | 89.3 | 22.3 | 21.4 |
| – COT Index Reading (3 Year Range): | Bullish-Extreme | Bearish | Bearish |
| NET POSITION MOVEMENT INDEX: | |||
| – 6-Week Change in Strength Index: | -10.7 | 15.1 | -26.1 |
10-Year Treasury Note Futures:
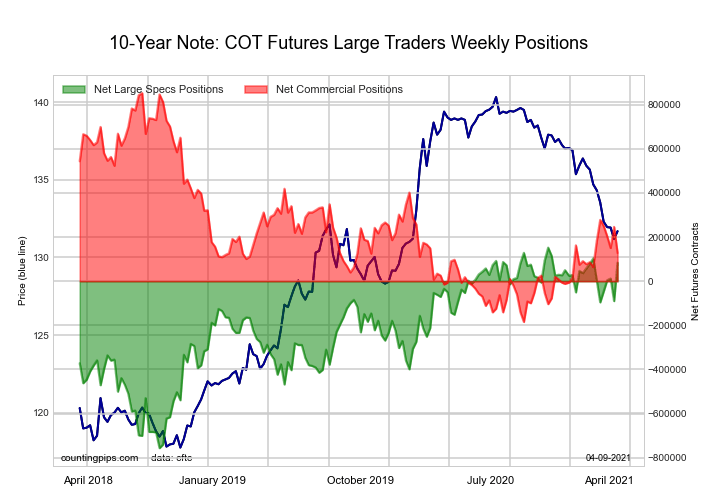
The 10-Year Treasury Note large speculator standing this week recorded a net position of 84,559 contracts in the data reported through Tuesday. This was a weekly gain of 174,361 contracts from the previous week which had a total of -89,802 net contracts.
This week’s current strength score (the trader positioning range over the past three years, measured from 0 to 100) shows the speculators are currently Bullish-Extreme with a score of 92.5 percent. The commercials are Bearish with a score of 30.1 percent and the small traders (not shown in chart) are Bearish-Extreme with a score of 16.2 percent.
| 10-Year Treasury Note Statistics | SPECULATORS | COMMERCIALS | SMALL TRADERS |
| – Percent of Open Interest Longs: | 18.7 | 72.0 | 8.0 |
| – Percent of Open Interest Shorts: | 16.5 | 68.7 | 13.4 |
| – Net Position: | 84,559 | 128,010 | -212,569 |
| – Gross Longs: | 732,687 | 2,821,476 | 313,947 |
| – Gross Shorts: | 648,128 | 2,693,466 | 526,516 |
| – Long to Short Ratio: | 1.1 to 1 | 1.0 to 1 | 0.6 to 1 |
| NET POSITION TREND: | |||
| – COT Index Score (3 Year Range Pct): | 92.5 | 30.1 | 16.2 |
| – COT Index Reading (3 Year Range): | Bullish-Extreme | Bearish | Bearish-Extreme |
| NET POSITION MOVEMENT INDEX: | |||
| – 6-Week Change in Strength Index: | 9.0 | -5.1 | -7.8 |
Ultra 10-Year Notes Futures:

The Ultra 10-Year Notes large speculator standing this week recorded a net position of 170,635 contracts in the data reported through Tuesday. This was a weekly decrease of -64,475 contracts from the previous week which had a total of 235,110 net contracts.
This week’s current strength score (the trader positioning range over the past three years, measured from 0 to 100) shows the speculators are currently Bullish with a score of 72.8 percent. The commercials are Bearish with a score of 34.0 percent and the small traders (not shown in chart) are Bearish-Extreme with a score of 0.0 percent.
| Ultra 10-Year Notes Statistics | SPECULATORS | COMMERCIALS | SMALL TRADERS |
| – Percent of Open Interest Longs: | 21.0 | 71.1 | 7.6 |
| – Percent of Open Interest Shorts: | 9.1 | 73.7 | 17.0 |
| – Net Position: | 170,635 | -36,437 | -134,198 |
| – Gross Longs: | 300,246 | 1,017,164 | 108,960 |
| – Gross Shorts: | 129,611 | 1,053,601 | 243,158 |
| – Long to Short Ratio: | 2.3 to 1 | 1.0 to 1 | 0.4 to 1 |
| NET POSITION TREND: | |||
| – COT Index Score (3 Year Range Pct): | 72.8 | 34.0 | 0.0 |
| – COT Index Reading (3 Year Range): | Bullish | Bearish | Bearish-Extreme |
| NET POSITION MOVEMENT INDEX: | |||
| – 6-Week Change in Strength Index: | -0.7 | 2.7 | -6.6 |
US Treasury Bonds Futures:
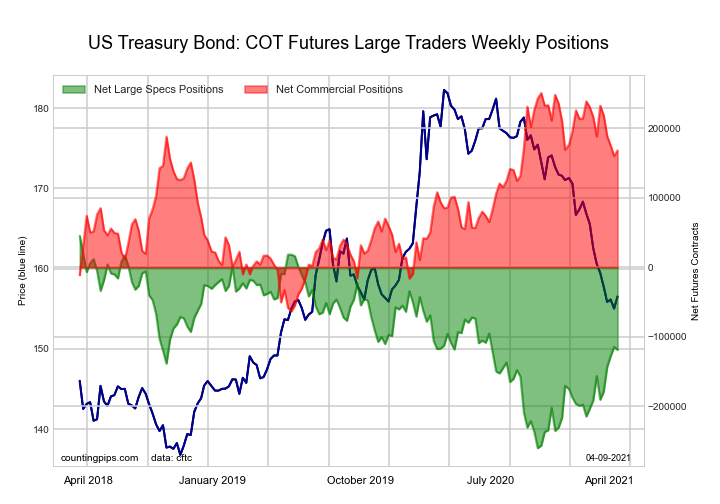
The US Treasury Bonds large speculator standing this week recorded a net position of -118,494 contracts in the data reported through Tuesday. This was a weekly decrease of -4,055 contracts from the previous week which had a total of -114,439 net contracts.
This week’s current strength score (the trader positioning range over the past three years, measured from 0 to 100) shows the speculators are currently Bearish with a score of 46.3 percent. The commercials are Bullish with a score of 73.7 percent and the small traders (not shown in chart) are Bearish-Extreme with a score of 16.2 percent.
| US Treasury Bonds Statistics | SPECULATORS | COMMERCIALS | SMALL TRADERS |
| – Percent of Open Interest Longs: | 6.2 | 78.6 | 13.2 |
| – Percent of Open Interest Shorts: | 16.3 | 64.3 | 17.5 |
| – Net Position: | -118,494 | 168,164 | -49,670 |
| – Gross Longs: | 72,722 | 920,918 | 154,881 |
| – Gross Shorts: | 191,216 | 752,754 | 204,551 |
| – Long to Short Ratio: | 0.4 to 1 | 1.2 to 1 | 0.8 to 1 |
| NET POSITION TREND: | |||
| – COT Index Score (3 Year Range Pct): | 46.3 | 73.7 | 16.2 |
| – COT Index Reading (3 Year Range): | Bearish | Bullish | Bearish-Extreme |
| NET POSITION MOVEMENT INDEX: | |||
| – 6-Week Change in Strength Index: | 12.4 | -6.4 | -13.6 |
Ultra US Treasury Bonds Futures:
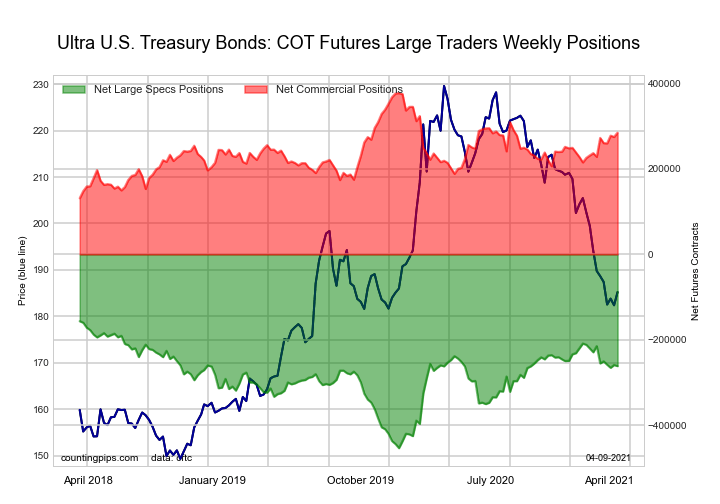
The Ultra US Treasury Bonds large speculator standing this week recorded a net position of -261,819 contracts in the data reported through Tuesday. This was a weekly reduction of -2,695 contracts from the previous week which had a total of -259,124 net contracts.
This week’s current strength score (the trader positioning range over the past three years, measured from 0 to 100) shows the speculators are currently Bullish with a score of 64.6 percent. The commercials are Bullish with a score of 62.3 percent and the small traders (not shown in chart) are Bearish-Extreme with a score of 0.0 percent.
| Ultra US Treasury Bonds Statistics | SPECULATORS | COMMERCIALS | SMALL TRADERS |
| – Percent of Open Interest Longs: | 5.1 | 82.7 | 11.8 |
| – Percent of Open Interest Shorts: | 28.2 | 57.6 | 13.8 |
| – Net Position: | -261,819 | 285,070 | -23,251 |
| – Gross Longs: | 58,261 | 938,845 | 133,842 |
| – Gross Shorts: | 320,080 | 653,775 | 157,093 |
| – Long to Short Ratio: | 0.2 to 1 | 1.4 to 1 | 0.9 to 1 |
| NET POSITION TREND: | |||
| – COT Index Score (3 Year Range Pct): | 64.6 | 62.3 | 0.0 |
| – COT Index Reading (3 Year Range): | Bullish | Bullish | Bearish-Extreme |
| NET POSITION MOVEMENT INDEX: | |||
| – 6-Week Change in Strength Index: | -15.7 | 22.9 | -7.9 |
3-Month Eurodollars Futures:
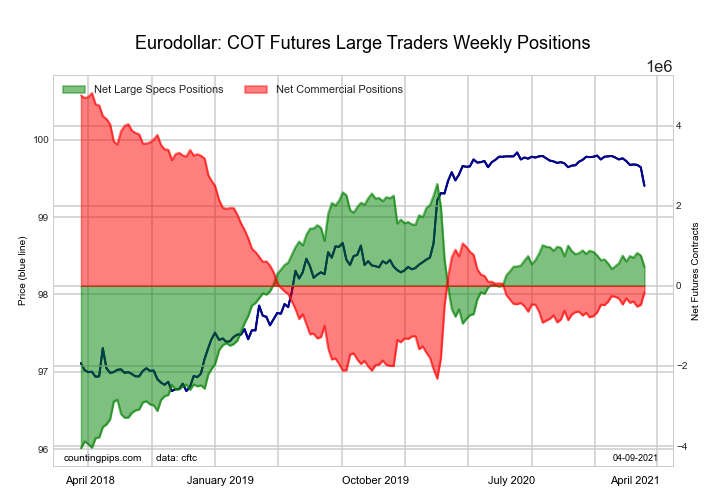
The 3-Month Eurodollars large speculator standing this week recorded a net position of 468,445 contracts in the data reported through Tuesday. This was a weekly fall of -289,661 contracts from the previous week which had a total of 758,106 net contracts.
This week’s current strength score (the trader positioning range over the past three years, measured from 0 to 100) shows the speculators are currently Bullish with a score of 68.5 percent. The commercials are Bearish with a score of 30.2 percent and the small traders (not shown in chart) are Bullish with a score of 63.7 percent.
| 3-Month Eurodollars Statistics | SPECULATORS | COMMERCIALS | SMALL TRADERS |
| – Percent of Open Interest Longs: | 20.1 | 49.5 | 5.1 |
| – Percent of Open Interest Shorts: | 16.0 | 50.9 | 7.8 |
| – Net Position: | 468,445 | -163,288 | -305,157 |
| – Gross Longs: | 2,331,761 | 5,751,008 | 596,999 |
| – Gross Shorts: | 1,863,316 | 5,914,296 | 902,156 |
| – Long to Short Ratio: | 1.3 to 1 | 1.0 to 1 | 0.7 to 1 |
| NET POSITION TREND: | |||
| – COT Index Score (3 Year Range Pct): | 68.5 | 30.2 | 63.7 |
| – COT Index Reading (3 Year Range): | Bullish | Bearish | Bullish |
| NET POSITION MOVEMENT INDEX: | |||
| – 6-Week Change in Strength Index: | -4.3 | 4.2 | -2.3 |
Article By CountingPips.com – Receive our weekly COT Reports by Email
*COT Report: The COT data, released weekly to the public each Friday, is updated through the most recent Tuesday (data is 3 days old) and shows a quick view of how large speculators or non-commercials (for-profit traders) were positioned in the futures markets.
The CFTC categorizes trader positions according to commercial hedgers (traders who use futures contracts for hedging as part of the business), non-commercials (large traders who speculate to realize trading profits) and nonreportable traders (usually small traders/speculators).
Find CFTC criteria here: (http://www.cftc.gov/MarketReports/CommitmentsofTraders/ExplanatoryNotes/index.htm).

- TSLA shares rose on a weak report. Inflationary pressures are easing in Australia Apr 24, 2024
- USDJPY: On intervention watch Apr 24, 2024
- Euro gains against the dollar amid mixed economic signals Apr 24, 2024
- PMI data is the focus of investors’ attention today. Turkey, Iraq, Qatar, and UAE signed a transportation agreement Apr 23, 2024
- Australian dollar rises on strong economic indicators Apr 23, 2024
- Geopolitical risks in the Middle East are declining. China kept interest rates at lows Apr 22, 2024
- Brent crude dips to four-week low amid easing geopolitical tensions Apr 22, 2024
- COT Metals Charts: Speculator bets led by Copper & Silver Apr 20, 2024
- COT Bonds Charts: Speculator bets led by 10-Year Bonds & Fed Funds Apr 20, 2024
- COT Stock Market Charts: Speculator bets led by S&P500-Mini Apr 20, 2024