
Article By RoboForex.com
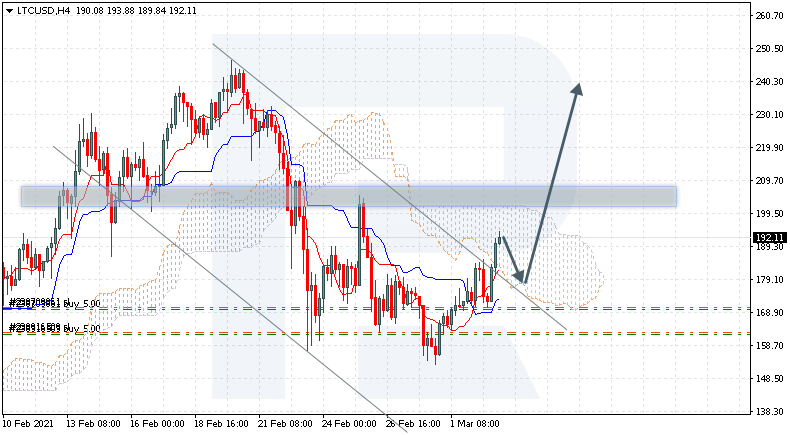
LTCUSD, “Litecoin vs US Dollar”
LTCUSD is trading at 192.11; the instrument is moving inside Ichimoku Cloud, thus indicating a sideways tendency. The markets could indicate that the price may test the cloud’s downside border at 180.05 and then resume moving upwards to reach 240.05. Another signal in favor of a further uptrend is a rebound from the descending channel’s upside. However, the bullish scenario may no longer be valid if the price breaks the cloud’s downside border and fixes below 157.05. In this case, the pair may continue falling towards 135.05. To confirm further growth, the asset must break the upside border of a Double Bottom pattern and fix above 210.55.

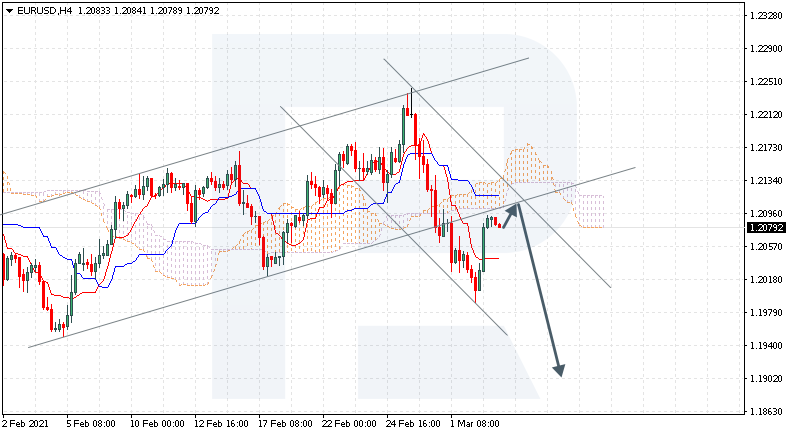
EURUSD, “Euro vs US Dollar”
EURUSD is trading at 1.2079; the instrument is moving below Ichimoku Cloud, thus indicating a descending tendency. The markets could indicate that the price may test the cloud’s downside border at 1.2105 and then resume moving downwards to reach 1.1905. Another signal in favor of a further downtrend will be a rebound from the rising channel’s downside border. However, the bearish scenario may be canceled if the price breaks the cloud’s upside border and fixes above 1.2185. In this case, the pair may continue growing towards 1.2275.
Free Reports:
 Get our Weekly Commitment of Traders Reports - See where the biggest traders (Hedge Funds and Commercial Hedgers) are positioned in the futures markets on a weekly basis.
 Download Our Metatrader 4 Indicators – Put Our Free MetaTrader 4 Custom Indicators on your charts when you join our Weekly Newsletter
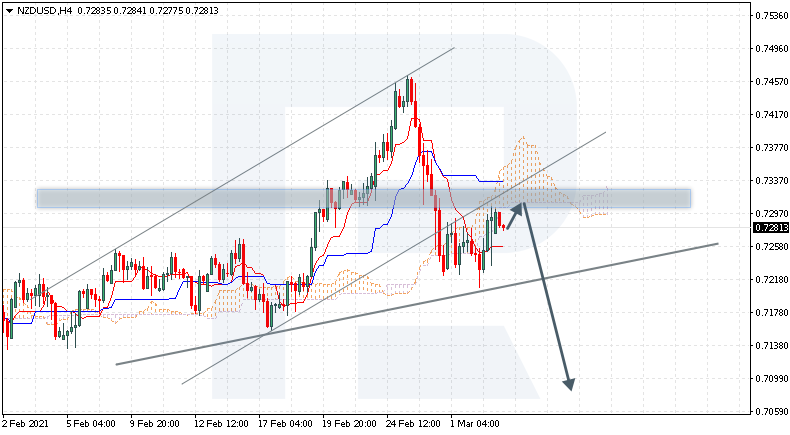
NZDUSD, “New Zealand Dollar vs US Dollar”
NZDUSD is trading at 0.7281; the instrument is moving below Ichimoku Cloud, thus indicating a descending tendency. The markets could indicate that the price may test the cloud’s downside border at 0.7305 and then resume moving downwards to reach 0.7075. Another signal in favor of a further downtrend will be a rebound from the rising channel’s downside border. However, the bearish scenario may be canceled if the price breaks the cloud’s upside border and fixes above 0.7415. In this case, the pair may continue growing towards 0.7505. To confirm further decline, the asset must break the support area and fix below 0.7210, thus indicating the completion of a Head & Shoulders reversal pattern.
Article By RoboForex.com
Attention!
Forecasts presented in this section only reflect the author’s private opinion and should not be considered as guidance for trading. RoboForex LP bears no responsibility for trading results based on trading recommendations described in these analytical reviews.

- 3 Signs of Developing U.S. Economic Slowdown Apr 19, 2024
- Israel has retaliated against Iran. Investors run to safe assets Apr 19, 2024
- Gold hits record high amid growing geopolitical tensions Apr 19, 2024
- The US natural gas prices fell to a 2-month low. A drop in the technology sector on Wednesday had a negative impact on the broad market Apr 18, 2024
- Target Thursdays: Cocoa, Bitcoin and USDCHF hit targets! Apr 18, 2024
- British Pound shows signs of recovery amid favourable inflation data Apr 18, 2024
- Indices decline amid hawkish comments from the Fed. Investors are waiting for Israel’s answer Apr 17, 2024
- EURGBP: Slams into support on hot UK inflation Apr 17, 2024
- Brent crude prices dip amid concerns over global demand Apr 17, 2024
- Stock indices sell-off amid rising geopolitical tensions in the Middle East. China’s GDP grew the most in a year Apr 16, 2024