
By CountingPips.com – Receive our weekly COT Reports by Email
Here are the latest charts and statistics for the Commitment of Traders (COT) data published by the Commodities Futures Trading Commission (CFTC).
The latest COT data is updated through Tuesday March 02 2021 and shows a quick view of how large traders (for-profit speculators and commercial entities) were positioned in the futures markets.
CORN:

| CORN Futures Statistics | SPECULATORS | COMMERCIALS | SMALL TRADERS |
| – Percent of Open Interest Longs: | 32.1 | 47.2 | 8.4 |
| – Percent of Open Interest Shorts: | 4.1 | 73.7 | 9.9 |
| – Net Position: | 503,765 | -476,208 | -27,557 |
| – Gross Longs: | 578,046 | 848,786 | 151,278 |
| – Gross Shorts: | 74,281 | 1,324,994 | 178,835 |
| – Long to Short Ratio: | 7.8 to 1 | 0.6 to 1 | 0.8 to 1 |
| NET POSITION TREND: | |||
| – COT Index Score (3 Year Range Pct): | 94.4 | 4.1 | 31.7 |
| – COT Index Reading (3 Year Range): | Bullish-Extreme | Bearish-Extreme | Bearish |
| NET POSITION MOVEMENT INDEX: | |||
| – 6-Week Change in Strength Index: | -3.2 | 1.8 | 6.4 |
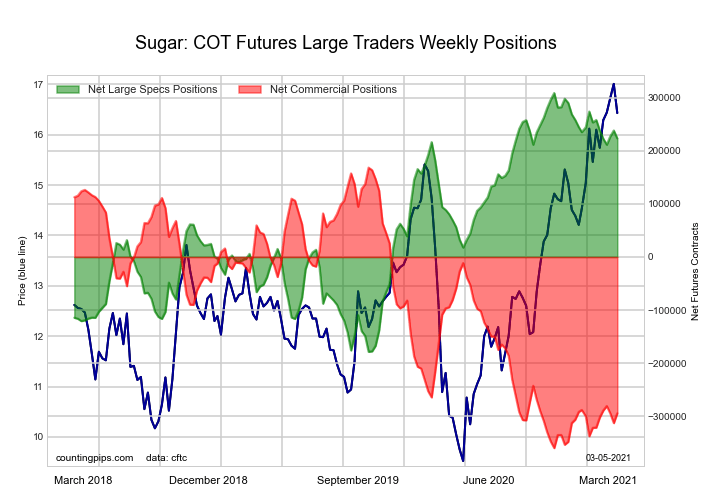
SUGAR:
Free Reports:
 Sign Up for Our Stock Market Newsletter – Get updated on News, Charts & Rankings of Public Companies when you join our Stocks Newsletter
 Get our Weekly Commitment of Traders Reports - See where the biggest traders (Hedge Funds and Commercial Hedgers) are positioned in the futures markets on a weekly basis.
| SUGAR Futures Statistics | SPECULATORS | COMMERCIALS | SMALL TRADERS |
| – Percent of Open Interest Longs: | 26.8 | 49.3 | 10.8 |
| – Percent of Open Interest Shorts: | 4.7 | 78.5 | 3.7 |
| – Net Position: | 223,020 | -294,206 | 71,186 |
| – Gross Longs: | 270,821 | 497,725 | 109,000 |
| – Gross Shorts: | 47,801 | 791,931 | 37,814 |
| – Long to Short Ratio: | 5.7 to 1 | 0.6 to 1 | 2.9 to 1 |
| NET POSITION TREND: | |||
| – COT Index Score (3 Year Range Pct): | 82.4 | 12.4 | 95.9 |
| – COT Index Reading (3 Year Range): | Bullish-Extreme | Bearish-Extreme | Bullish-Extreme |
| NET POSITION MOVEMENT INDEX: | |||
| – 6-Week Change in Strength Index: | -7.1 | 5.1 | 9.7 |
COFFEE:
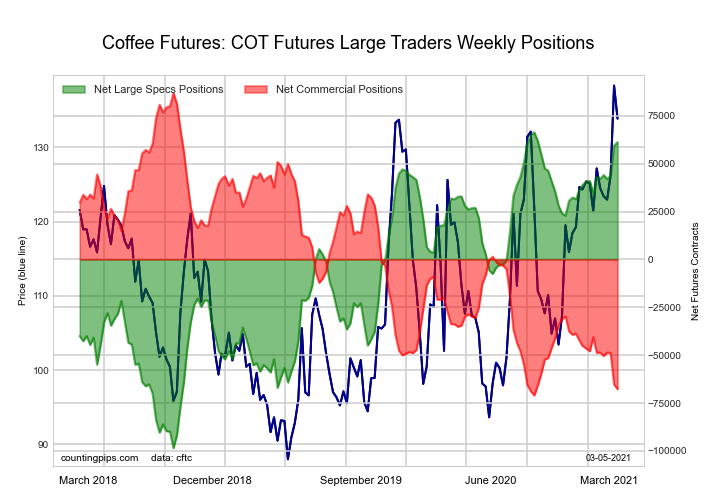
| COFFEE Futures Statistics | SPECULATORS | COMMERCIALS | SMALL TRADERS |
| – Percent of Open Interest Longs: | 29.9 | 44.4 | 4.6 |
| – Percent of Open Interest Shorts: | 6.8 | 69.9 | 2.2 |
| – Net Position: | 61,250 | -67,695 | 6,445 |
| – Gross Longs: | 79,433 | 117,785 | 12,209 |
| – Gross Shorts: | 18,183 | 185,480 | 5,764 |
| – Long to Short Ratio: | 4.4 to 1 | 0.6 to 1 | 2.1 to 1 |
| NET POSITION TREND: | |||
| – COT Index Score (3 Year Range Pct): | 96.9 | 2.1 | 33.0 |
| – COT Index Reading (3 Year Range): | Bullish-Extreme | Bearish-Extreme | Bearish |
| NET POSITION MOVEMENT INDEX: | |||
| – 6-Week Change in Strength Index: | 11.1 | -12.0 | 4.8 |
SOYBEANS:
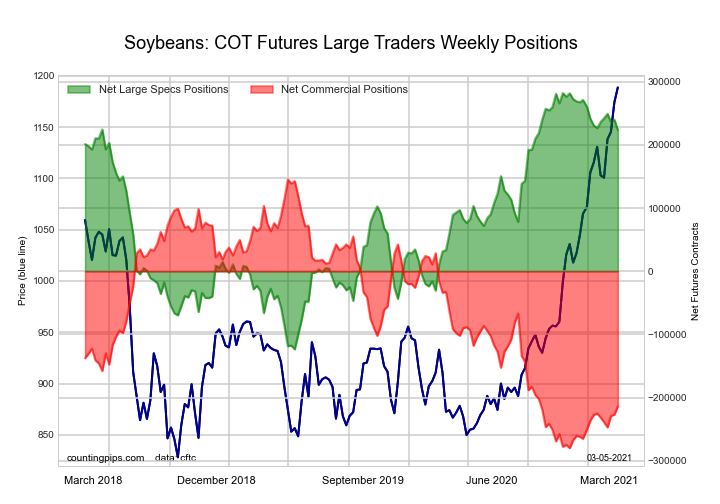
| SOYBEANS Futures Statistics | SPECULATORS | COMMERCIALS | SMALL TRADERS |
| – Percent of Open Interest Longs: | 30.9 | 46.4 | 7.6 |
| – Percent of Open Interest Shorts: | 4.6 | 71.6 | 8.8 |
| – Net Position: | 223,662 | -213,678 | -9,984 |
| – Gross Longs: | 262,350 | 393,930 | 64,523 |
| – Gross Shorts: | 38,688 | 607,608 | 74,507 |
| – Long to Short Ratio: | 6.8 to 1 | 0.6 to 1 | 0.9 to 1 |
| NET POSITION TREND: | |||
| – COT Index Score (3 Year Range Pct): | 85.6 | 15.5 | 69.1 |
| – COT Index Reading (3 Year Range): | Bullish-Extreme | Bearish-Extreme | Bullish |
| NET POSITION MOVEMENT INDEX: | |||
| – 6-Week Change in Strength Index: | -0.7 | 2.7 | -9.5 |
SOYBEAN OIL:
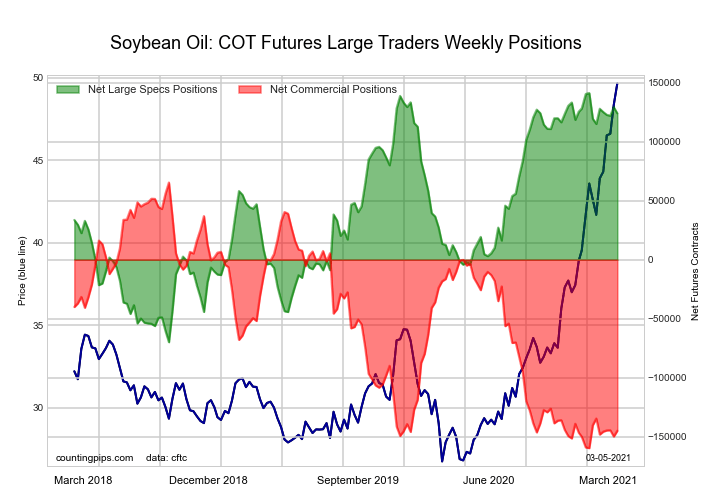
| SOYBEAN OIL Futures Statistics | SPECULATORS | COMMERCIALS | SMALL TRADERS |
| – Percent of Open Interest Longs: | 30.9 | 42.1 | 9.6 |
| – Percent of Open Interest Shorts: | 4.9 | 72.5 | 5.2 |
| – Net Position: | 123,987 | -144,883 | 20,896 |
| – Gross Longs: | 147,156 | 199,989 | 45,548 |
| – Gross Shorts: | 23,169 | 344,872 | 24,652 |
| – Long to Short Ratio: | 6.4 to 1 | 0.6 to 1 | 1.8 to 1 |
| NET POSITION TREND: | |||
| – COT Index Score (3 Year Range Pct): | 91.9 | 6.5 | 94.1 |
| – COT Index Reading (3 Year Range): | Bullish-Extreme | Bearish-Extreme | Bullish-Extreme |
| NET POSITION MOVEMENT INDEX: | |||
| – 6-Week Change in Strength Index: | 4.2 | -4.6 | 5.5 |
SOYBEAN MEAL:
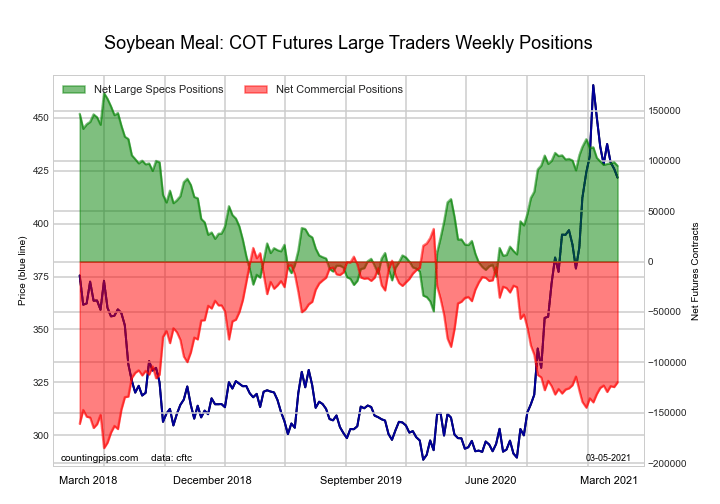
| SOYBEAN MEAL Futures Statistics | SPECULATORS | COMMERCIALS | SMALL TRADERS |
| – Percent of Open Interest Longs: | 27.3 | 46.7 | 12.7 |
| – Percent of Open Interest Shorts: | 3.7 | 76.4 | 6.6 |
| – Net Position: | 95,205 | -119,728 | 24,523 |
| – Gross Longs: | 110,057 | 188,094 | 50,971 |
| – Gross Shorts: | 14,852 | 307,822 | 26,448 |
| – Long to Short Ratio: | 7.4 to 1 | 0.6 to 1 | 1.9 to 1 |
| NET POSITION TREND: | |||
| – COT Index Score (3 Year Range Pct): | 66.7 | 30.1 | 68.9 |
| – COT Index Reading (3 Year Range): | Bullish | Bearish | Bullish |
| NET POSITION MOVEMENT INDEX: | |||
| – 6-Week Change in Strength Index: | -3.7 | 5.4 | -15.3 |
LIVE CATTLE:

| LIVE CATTLE Futures Statistics | SPECULATORS | COMMERCIALS | SMALL TRADERS |
| – Percent of Open Interest Longs: | 37.1 | 36.1 | 8.7 |
| – Percent of Open Interest Shorts: | 12.1 | 57.9 | 12.0 |
| – Net Position: | 83,632 | -72,809 | -10,823 |
| – Gross Longs: | 124,188 | 120,872 | 29,257 |
| – Gross Shorts: | 40,556 | 193,681 | 40,080 |
| – Long to Short Ratio: | 3.1 to 1 | 0.6 to 1 | 0.7 to 1 |
| NET POSITION TREND: | |||
| – COT Index Score (3 Year Range Pct): | 47.0 | 46.7 | 60.7 |
| – COT Index Reading (3 Year Range): | Bearish | Bearish | Bullish |
| NET POSITION MOVEMENT INDEX: | |||
| – 6-Week Change in Strength Index: | 21.0 | -25.8 | -0.7 |
LEAN HOGS:
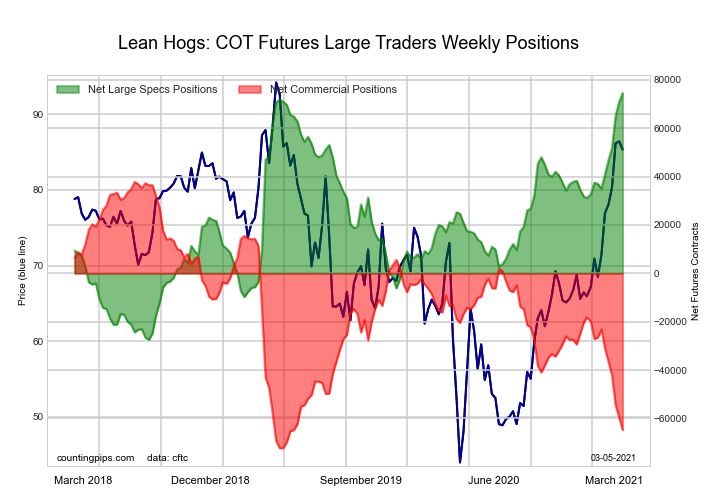
| LEAN HOGS Futures Statistics | SPECULATORS | COMMERCIALS | SMALL TRADERS |
| – Percent of Open Interest Longs: | 40.9 | 30.3 | 8.2 |
| – Percent of Open Interest Shorts: | 12.6 | 54.9 | 11.9 |
| – Net Position: | 74,565 | -64,720 | -9,845 |
| – Gross Longs: | 107,719 | 79,999 | 21,555 |
| – Gross Shorts: | 33,154 | 144,719 | 31,400 |
| – Long to Short Ratio: | 3.2 to 1 | 0.6 to 1 | 0.7 to 1 |
| NET POSITION TREND: | |||
| – COT Index Score (3 Year Range Pct): | 100.0 | 6.8 | 33.2 |
| – COT Index Reading (3 Year Range): | Bullish-Extreme | Bearish-Extreme | Bearish |
| NET POSITION MOVEMENT INDEX: | |||
| – 6-Week Change in Strength Index: | 38.7 | -37.8 | 9.5 |
COTTON:
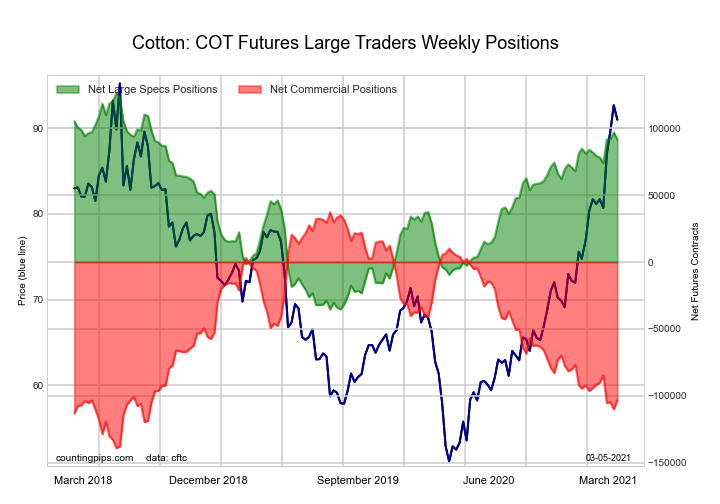
| COTTON Futures Statistics | SPECULATORS | COMMERCIALS | SMALL TRADERS |
| – Percent of Open Interest Longs: | 41.7 | 38.5 | 7.4 |
| – Percent of Open Interest Shorts: | 3.6 | 81.5 | 2.6 |
| – Net Position: | 91,575 | -103,216 | 11,641 |
| – Gross Longs: | 100,222 | 92,544 | 17,770 |
| – Gross Shorts: | 8,647 | 195,760 | 6,129 |
| – Long to Short Ratio: | 11.6 to 1 | 0.5 to 1 | 2.9 to 1 |
| NET POSITION TREND: | |||
| – COT Index Score (3 Year Range Pct): | 78.5 | 20.3 | 80.6 |
| – COT Index Reading (3 Year Range): | Bullish | Bearish | Bullish-Extreme |
| NET POSITION MOVEMENT INDEX: | |||
| – 6-Week Change in Strength Index: | 7.5 | -6.5 | -4.3 |
COCOA:
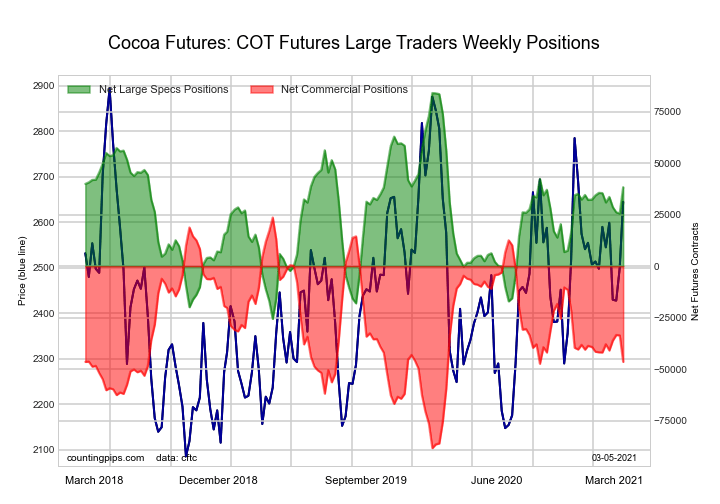
| COCOA Futures Statistics | SPECULATORS | COMMERCIALS | SMALL TRADERS |
| – Percent of Open Interest Longs: | 36.1 | 38.2 | 6.6 |
| – Percent of Open Interest Shorts: | 17.5 | 60.7 | 2.7 |
| – Net Position: | 38,378 | -46,423 | 8,045 |
| – Gross Longs: | 74,545 | 78,896 | 13,669 |
| – Gross Shorts: | 36,167 | 125,319 | 5,624 |
| – Long to Short Ratio: | 2.1 to 1 | 0.6 to 1 | 2.4 to 1 |
| NET POSITION TREND: | |||
| – COT Index Score (3 Year Range Pct): | 58.3 | 37.4 | 100.0 |
| – COT Index Reading (3 Year Range): | Bullish | Bearish | Bullish-Extreme |
| NET POSITION MOVEMENT INDEX: | |||
| – 6-Week Change in Strength Index: | 2.6 | -4.1 | 19.3 |
WHEAT:
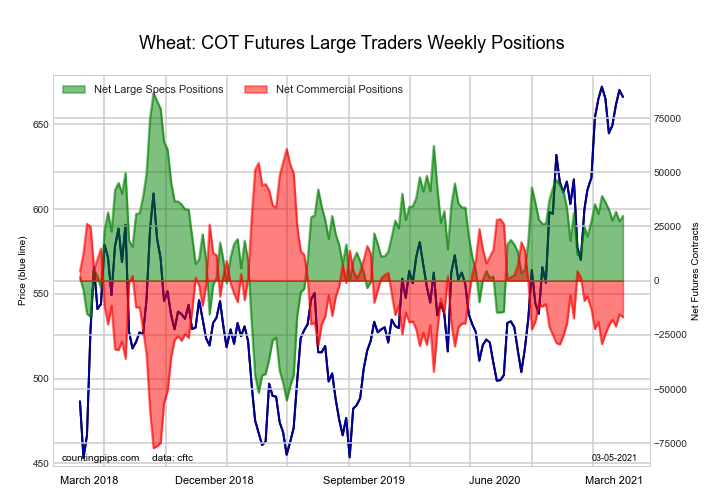
| WHEAT Futures Statistics | SPECULATORS | COMMERCIALS | SMALL TRADERS |
| – Percent of Open Interest Longs: | 30.9 | 37.1 | 7.8 |
| – Percent of Open Interest Shorts: | 23.8 | 41.1 | 10.9 |
| – Net Position: | 29,931 | -16,808 | -13,123 |
| – Gross Longs: | 129,502 | 155,541 | 32,463 |
| – Gross Shorts: | 99,571 | 172,349 | 45,586 |
| – Long to Short Ratio: | 1.3 to 1 | 0.9 to 1 | 0.7 to 1 |
| NET POSITION TREND: | |||
| – COT Index Score (3 Year Range Pct): | 60.1 | 43.8 | 38.9 |
| – COT Index Reading (3 Year Range): | Bullish | Bearish | Bearish |
| NET POSITION MOVEMENT INDEX: | |||
| – 6-Week Change in Strength Index: | -6.4 | 9.0 | -15.4 |
Article By CountingPips.com – Receive our weekly COT Reports by Email
*COT Report: The COT data, released weekly to the public each Friday, is updated through the most recent Tuesday (data is 3 days old) and shows a quick view of how large speculators or non-commercials (for-profit traders) were positioned in the futures markets.
The CFTC categorizes trader positions according to commercial hedgers (traders who use futures contracts for hedging as part of the business), non-commercials (large traders who speculate to realize trading profits) and nonreportable traders (usually small traders/speculators).
Find CFTC criteria here: (http://www.cftc.gov/MarketReports/CommitmentsofTraders/ExplanatoryNotes/index.htm).

- Stock indices sell-off amid rising geopolitical tensions in the Middle East. China’s GDP grew the most in a year Apr 16, 2024
- New FXTM commodity hits all-time high! Apr 16, 2024
- NZD hits five-month low against strong US dollar Apr 16, 2024
- Escalating conflict in the Middle East is forcing investors to shift funds to safe assets Apr 15, 2024
- US dollar exhibits remarkable strength amid global tensions Apr 15, 2024
- COT Metals Charts: Speculator bets led higher by Copper & Platinum Apr 13, 2024
- COT Bonds Charts: Speculator Bets led by 10-Year & 5-Year Bonds Apr 13, 2024
- COT Soft Commodities Charts: Speculator Bets led by Soybean Meal & Lean Hogs Apr 13, 2024
- COT Stock Market Charts: Weekly Speculator Bets led by VIX & S&P500-Mini Apr 13, 2024
- Singapore’s central bank (MAS) maintained its monetary policy settings. The ECB hinted at a rate cut soon Apr 12, 2024