
By CountingPips.com – Receive our weekly COT Reports by Email
Here are the latest charts and statistics for the Commitment of Traders (COT) data published by the Commodities Futures Trading Commission (CFTC).
The latest COT data is updated through Tuesday March 09 2021 and shows a quick view of how large traders (for-profit speculators and commercial entities) were positioned in the futures markets.
CORN:

| CORN Futures Statistics | SPECULATORS | COMMERCIALS | SMALL TRADERS |
| – Percent of Open Interest Longs: | 32.5 | 46.9 | 8.6 |
| – Percent of Open Interest Shorts: | 4.4 | 73.6 | 10.0 |
| – Net Position: | 503,398 | -478,215 | -25,183 |
| – Gross Longs: | 582,449 | 839,209 | 153,176 |
| – Gross Shorts: | 79,051 | 1,317,424 | 178,359 |
| – Long to Short Ratio: | 7.4 to 1 | 0.6 to 1 | 0.9 to 1 |
| NET POSITION TREND: | |||
| – COT Index Score (3 Year Range Pct): | 94.3 | 3.8 | 33.0 |
| – COT Index Reading (3 Year Range): | Bullish-Extreme | Bearish-Extreme | Bearish |
| NET POSITION MOVEMENT INDEX: | |||
| – 6-Week Change in Strength Index: | -5.7 | 3.8 | 9.4 |
SUGAR:

Free Reports:
 Get our Weekly Commitment of Traders Reports - See where the biggest traders (Hedge Funds and Commercial Hedgers) are positioned in the futures markets on a weekly basis.
 Download Our Metatrader 4 Indicators – Put Our Free MetaTrader 4 Custom Indicators on your charts when you join our Weekly Newsletter
| SUGAR Futures Statistics | SPECULATORS | COMMERCIALS | SMALL TRADERS |
| – Percent of Open Interest Longs: | 25.9 | 49.8 | 10.6 |
| – Percent of Open Interest Shorts: | 5.3 | 76.9 | 4.1 |
| – Net Position: | 212,933 | -279,612 | 66,679 |
| – Gross Longs: | 267,363 | 513,936 | 109,192 |
| – Gross Shorts: | 54,430 | 793,548 | 42,513 |
| – Long to Short Ratio: | 4.9 to 1 | 0.6 to 1 | 2.6 to 1 |
| NET POSITION TREND: | |||
| – COT Index Score (3 Year Range Pct): | 80.4 | 15.1 | 90.4 |
| – COT Index Reading (3 Year Range): | Bullish-Extreme | Bearish-Extreme | Bullish-Extreme |
| NET POSITION MOVEMENT INDEX: | |||
| – 6-Week Change in Strength Index: | -5.1 | 4.2 | 3.2 |
COFFEE:
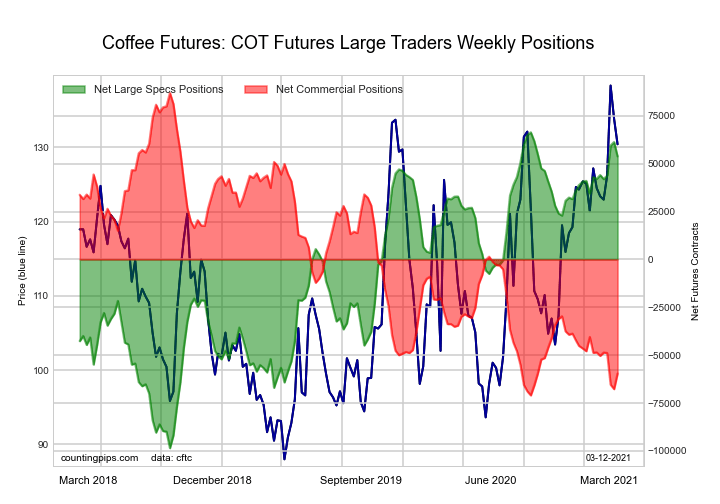
| COFFEE Futures Statistics | SPECULATORS | COMMERCIALS | SMALL TRADERS |
| – Percent of Open Interest Longs: | 27.0 | 44.8 | 4.3 |
| – Percent of Open Interest Shorts: | 7.5 | 66.4 | 2.2 |
| – Net Position: | 53,784 | -59,570 | 5,786 |
| – Gross Longs: | 74,405 | 123,600 | 11,863 |
| – Gross Shorts: | 20,621 | 183,170 | 6,077 |
| – Long to Short Ratio: | 3.6 to 1 | 0.7 to 1 | 2.0 to 1 |
| NET POSITION TREND: | |||
| – COT Index Score (3 Year Range Pct): | 92.4 | 7.2 | 28.4 |
| – COT Index Reading (3 Year Range): | Bullish-Extreme | Bearish-Extreme | Bearish |
| NET POSITION MOVEMENT INDEX: | |||
| – 6-Week Change in Strength Index: | 7.1 | -7.0 | -4.7 |
SOYBEANS:

| SOYBEANS Futures Statistics | SPECULATORS | COMMERCIALS | SMALL TRADERS |
| – Percent of Open Interest Longs: | 30.7 | 46.1 | 7.7 |
| – Percent of Open Interest Shorts: | 4.7 | 71.0 | 8.7 |
| – Net Position: | 224,745 | -215,869 | -8,876 |
| – Gross Longs: | 265,874 | 399,748 | 66,705 |
| – Gross Shorts: | 41,129 | 615,617 | 75,581 |
| – Long to Short Ratio: | 6.5 to 1 | 0.6 to 1 | 0.9 to 1 |
| NET POSITION TREND: | |||
| – COT Index Score (3 Year Range Pct): | 85.9 | 15.0 | 70.4 |
| – COT Index Reading (3 Year Range): | Bullish-Extreme | Bearish-Extreme | Bullish |
| NET POSITION MOVEMENT INDEX: | |||
| – 6-Week Change in Strength Index: | -2.9 | 3.6 | -4.4 |
SOYBEAN OIL:
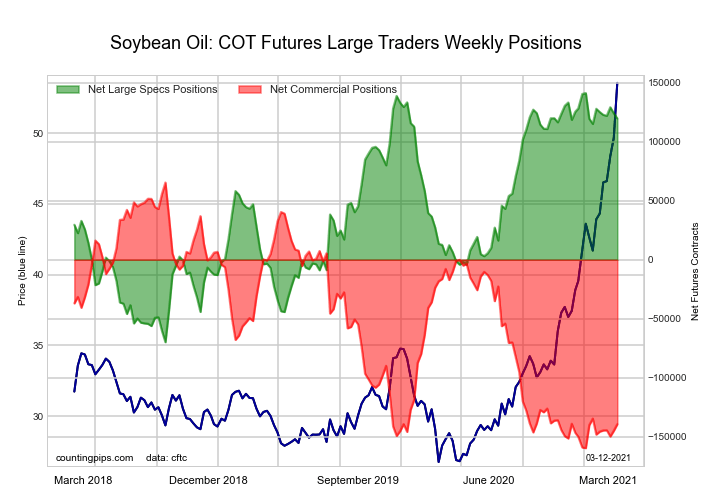
| SOYBEAN OIL Futures Statistics | SPECULATORS | COMMERCIALS | SMALL TRADERS |
| – Percent of Open Interest Longs: | 29.7 | 42.6 | 9.4 |
| – Percent of Open Interest Shorts: | 5.5 | 70.9 | 5.4 |
| – Net Position: | 119,634 | -139,323 | 19,689 |
| – Gross Longs: | 146,506 | 210,134 | 46,484 |
| – Gross Shorts: | 26,872 | 349,457 | 26,795 |
| – Long to Short Ratio: | 5.5 to 1 | 0.6 to 1 | 1.7 to 1 |
| NET POSITION TREND: | |||
| – COT Index Score (3 Year Range Pct): | 89.8 | 9.0 | 89.5 |
| – COT Index Reading (3 Year Range): | Bullish-Extreme | Bearish-Extreme | Bullish-Extreme |
| NET POSITION MOVEMENT INDEX: | |||
| – 6-Week Change in Strength Index: | -3.9 | 3.9 | -2.1 |
SOYBEAN MEAL:
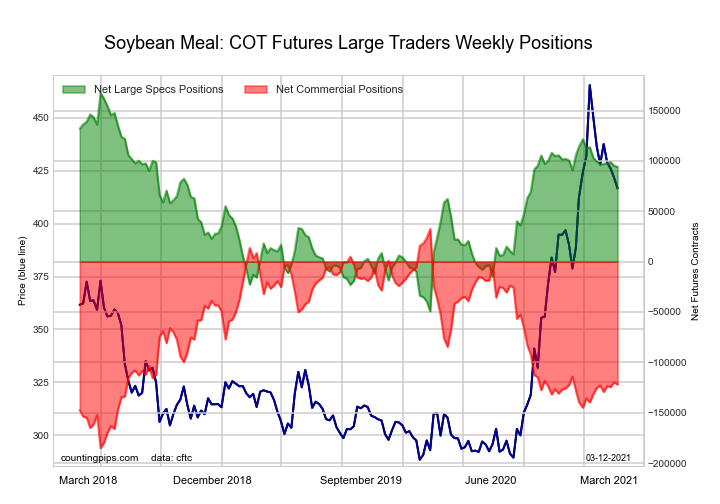
| SOYBEAN MEAL Futures Statistics | SPECULATORS | COMMERCIALS | SMALL TRADERS |
| – Percent of Open Interest Longs: | 26.9 | 46.4 | 13.3 |
| – Percent of Open Interest Shorts: | 4.0 | 76.1 | 6.5 |
| – Net Position: | 94,155 | -122,076 | 27,921 |
| – Gross Longs: | 110,628 | 190,703 | 54,608 |
| – Gross Shorts: | 16,473 | 312,779 | 26,687 |
| – Long to Short Ratio: | 6.7 to 1 | 0.6 to 1 | 2.0 to 1 |
| NET POSITION TREND: | |||
| – COT Index Score (3 Year Range Pct): | 66.2 | 29.0 | 82.5 |
| – COT Index Reading (3 Year Range): | Bullish | Bearish | Bullish-Extreme |
| NET POSITION MOVEMENT INDEX: | |||
| – 6-Week Change in Strength Index: | -2.5 | 1.5 | 8.4 |
LIVE CATTLE:
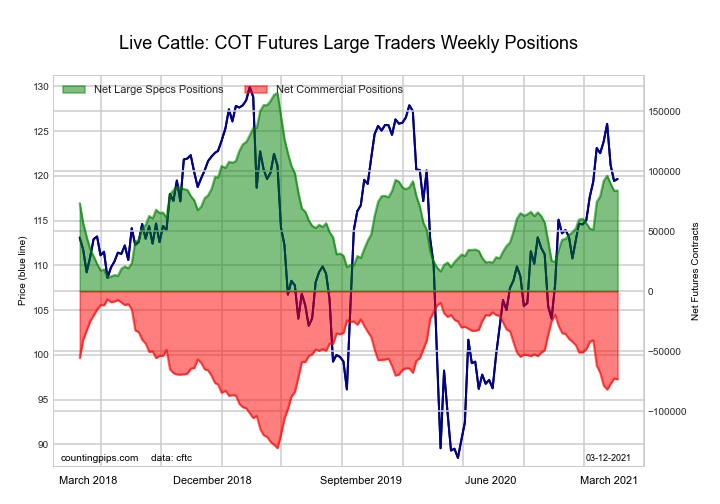
| LIVE CATTLE Futures Statistics | SPECULATORS | COMMERCIALS | SMALL TRADERS |
| – Percent of Open Interest Longs: | 37.0 | 36.4 | 9.7 |
| – Percent of Open Interest Shorts: | 11.8 | 58.5 | 12.9 |
| – Net Position: | 83,876 | -73,407 | -10,469 |
| – Gross Longs: | 123,289 | 121,160 | 32,398 |
| – Gross Shorts: | 39,413 | 194,567 | 42,867 |
| – Long to Short Ratio: | 3.1 to 1 | 0.6 to 1 | 0.8 to 1 |
| NET POSITION TREND: | |||
| – COT Index Score (3 Year Range Pct): | 47.2 | 46.3 | 61.6 |
| – COT Index Reading (3 Year Range): | Bearish | Bearish | Bullish |
| NET POSITION MOVEMENT INDEX: | |||
| – 6-Week Change in Strength Index: | 6.1 | -9.1 | 4.5 |
LEAN HOGS:

| LEAN HOGS Futures Statistics | SPECULATORS | COMMERCIALS | SMALL TRADERS |
| – Percent of Open Interest Longs: | 42.1 | 30.3 | 8.9 |
| – Percent of Open Interest Shorts: | 12.5 | 56.6 | 12.2 |
| – Net Position: | 78,335 | -69,614 | -8,721 |
| – Gross Longs: | 111,301 | 80,020 | 23,534 |
| – Gross Shorts: | 32,966 | 149,634 | 32,255 |
| – Long to Short Ratio: | 3.4 to 1 | 0.5 to 1 | 0.7 to 1 |
| NET POSITION TREND: | |||
| – COT Index Score (3 Year Range Pct): | 100.0 | 2.4 | 38.4 |
| – COT Index Reading (3 Year Range): | Bullish-Extreme | Bearish-Extreme | Bearish |
| NET POSITION MOVEMENT INDEX: | |||
| – 6-Week Change in Strength Index: | 35.5 | -35.0 | 4.7 |
COTTON:
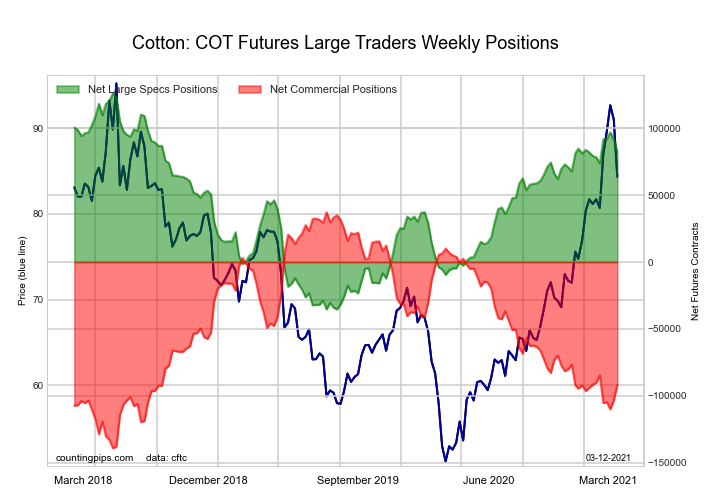
| COTTON Futures Statistics | SPECULATORS | COMMERCIALS | SMALL TRADERS |
| – Percent of Open Interest Longs: | 39.5 | 41.1 | 7.4 |
| – Percent of Open Interest Shorts: | 4.1 | 80.4 | 3.3 |
| – Net Position: | 82,361 | -91,772 | 9,411 |
| – Gross Longs: | 92,023 | 95,711 | 17,198 |
| – Gross Shorts: | 9,662 | 187,483 | 7,787 |
| – Long to Short Ratio: | 9.5 to 1 | 0.5 to 1 | 2.2 to 1 |
| NET POSITION TREND: | |||
| – COT Index Score (3 Year Range Pct): | 72.8 | 26.8 | 67.6 |
| – COT Index Reading (3 Year Range): | Bullish | Bearish | Bullish |
| NET POSITION MOVEMENT INDEX: | |||
| – 6-Week Change in Strength Index: | 2.6 | -1.0 | -14.2 |
COCOA:
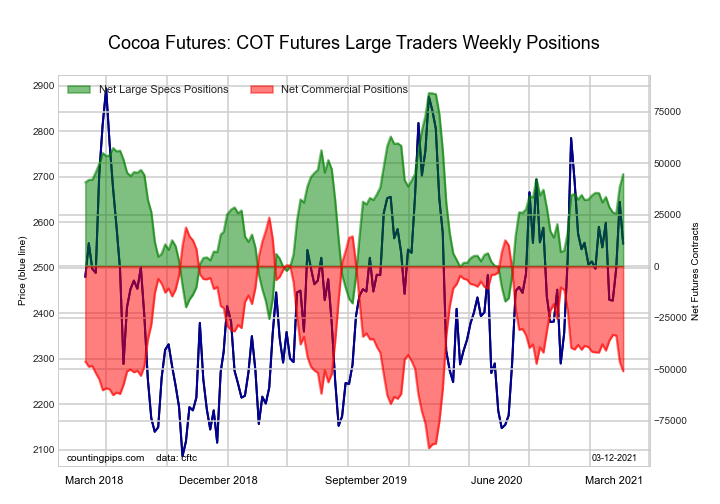
| COCOA Futures Statistics | SPECULATORS | COMMERCIALS | SMALL TRADERS |
| – Percent of Open Interest Longs: | 38.3 | 37.1 | 5.9 |
| – Percent of Open Interest Shorts: | 16.0 | 62.6 | 2.7 |
| – Net Position: | 44,721 | -50,956 | 6,235 |
| – Gross Longs: | 76,611 | 74,136 | 11,692 |
| – Gross Shorts: | 31,890 | 125,092 | 5,457 |
| – Long to Short Ratio: | 2.4 to 1 | 0.6 to 1 | 2.1 to 1 |
| NET POSITION TREND: | |||
| – COT Index Score (3 Year Range Pct): | 64.1 | 33.4 | 79.4 |
| – COT Index Reading (3 Year Range): | Bullish | Bearish | Bullish |
| NET POSITION MOVEMENT INDEX: | |||
| – 6-Week Change in Strength Index: | 12.5 | -11.7 | -7.2 |
WHEAT:
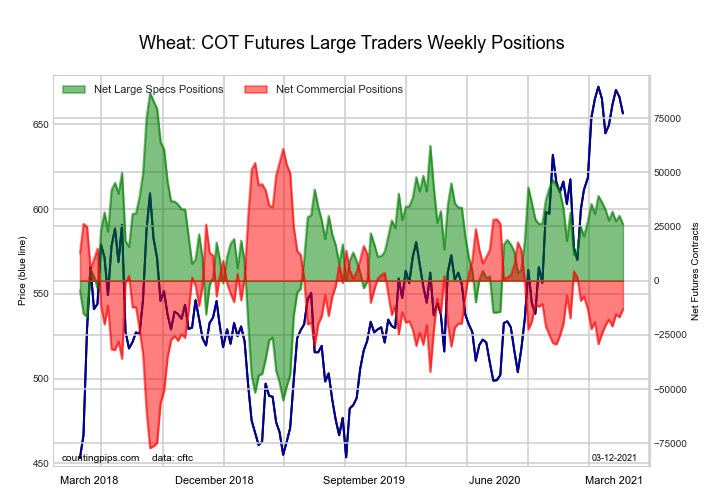
| WHEAT Futures Statistics | SPECULATORS | COMMERCIALS | SMALL TRADERS |
| – Percent of Open Interest Longs: | 29.6 | 37.1 | 7.8 |
| – Percent of Open Interest Shorts: | 23.3 | 40.3 | 11.0 |
| – Net Position: | 26,086 | -13,162 | -12,924 |
| – Gross Longs: | 121,874 | 152,794 | 32,296 |
| – Gross Shorts: | 95,788 | 165,956 | 45,220 |
| – Long to Short Ratio: | 1.3 to 1 | 0.9 to 1 | 0.7 to 1 |
| NET POSITION TREND: | |||
| – COT Index Score (3 Year Range Pct): | 57.3 | 46.4 | 39.9 |
| – COT Index Reading (3 Year Range): | Bullish | Bearish | Bearish |
| NET POSITION MOVEMENT INDEX: | |||
| – 6-Week Change in Strength Index: | -7.1 | 8.2 | -6.0 |
Article By CountingPips.com – Receive our weekly COT Reports by Email
*COT Report: The COT data, released weekly to the public each Friday, is updated through the most recent Tuesday (data is 3 days old) and shows a quick view of how large speculators or non-commercials (for-profit traders) were positioned in the futures markets.
The CFTC categorizes trader positions according to commercial hedgers (traders who use futures contracts for hedging as part of the business), non-commercials (large traders who speculate to realize trading profits) and nonreportable traders (usually small traders/speculators).
Find CFTC criteria here: (http://www.cftc.gov/MarketReports/CommitmentsofTraders/ExplanatoryNotes/index.htm).

- TSLA shares rose on a weak report. Inflationary pressures are easing in Australia Apr 24, 2024
- USDJPY: On intervention watch Apr 24, 2024
- Euro gains against the dollar amid mixed economic signals Apr 24, 2024
- PMI data is the focus of investors’ attention today. Turkey, Iraq, Qatar, and UAE signed a transportation agreement Apr 23, 2024
- Australian dollar rises on strong economic indicators Apr 23, 2024
- Geopolitical risks in the Middle East are declining. China kept interest rates at lows Apr 22, 2024
- Brent crude dips to four-week low amid easing geopolitical tensions Apr 22, 2024
- COT Metals Charts: Speculator bets led by Copper & Silver Apr 20, 2024
- COT Bonds Charts: Speculator bets led by 10-Year Bonds & Fed Funds Apr 20, 2024
- COT Stock Market Charts: Speculator bets led by S&P500-Mini Apr 20, 2024