
Walmart shares were down more than 6% on Thursday after the world’s biggest retailer posted a fourth-quarter earnings miss. While the retailer’s e-commerce sales in the US grew by 69%, investors were given the warning sign when the company said it expects sales to moderate this year.
The long-term monthly has been showing signs of extreme bullish positioning in recent years, with a huge acceleration higher over the pandemic period. As investors may already be heavy long, the stock price becomes much more sensitive to negative headlines as short-term, emotional investors scramble for the exit.
 Source: Admiral Markets MetaTrader 5, #WMT, Monthly – Data range: from Aug 1, 2005, to Feb 18, 2021, performed on Feb 18, 2021, at 8:30 pm GMT. Please note: Past performance is not a reliable indicator of future results.
In the long-term, monthly price chart of Walmart’s share price above, the 20-period (blue), 50-period (red) and 100-period (green) exponential moving averages are still pointing higher confirming the overall uptrend.
However, with the price so overextended from the 20-period moving average, there is the possibility of a pullback towards it. The negative earnings announcement could be the trigger.
Free Reports:
 Sign Up for Our Stock Market Newsletter – Get updated on News, Charts & Rankings of Public Companies when you join our Stocks Newsletter
 Get our Weekly Commitment of Traders Reports - See where the biggest traders (Hedge Funds and Commercial Hedgers) are positioned in the futures markets on a weekly basis.
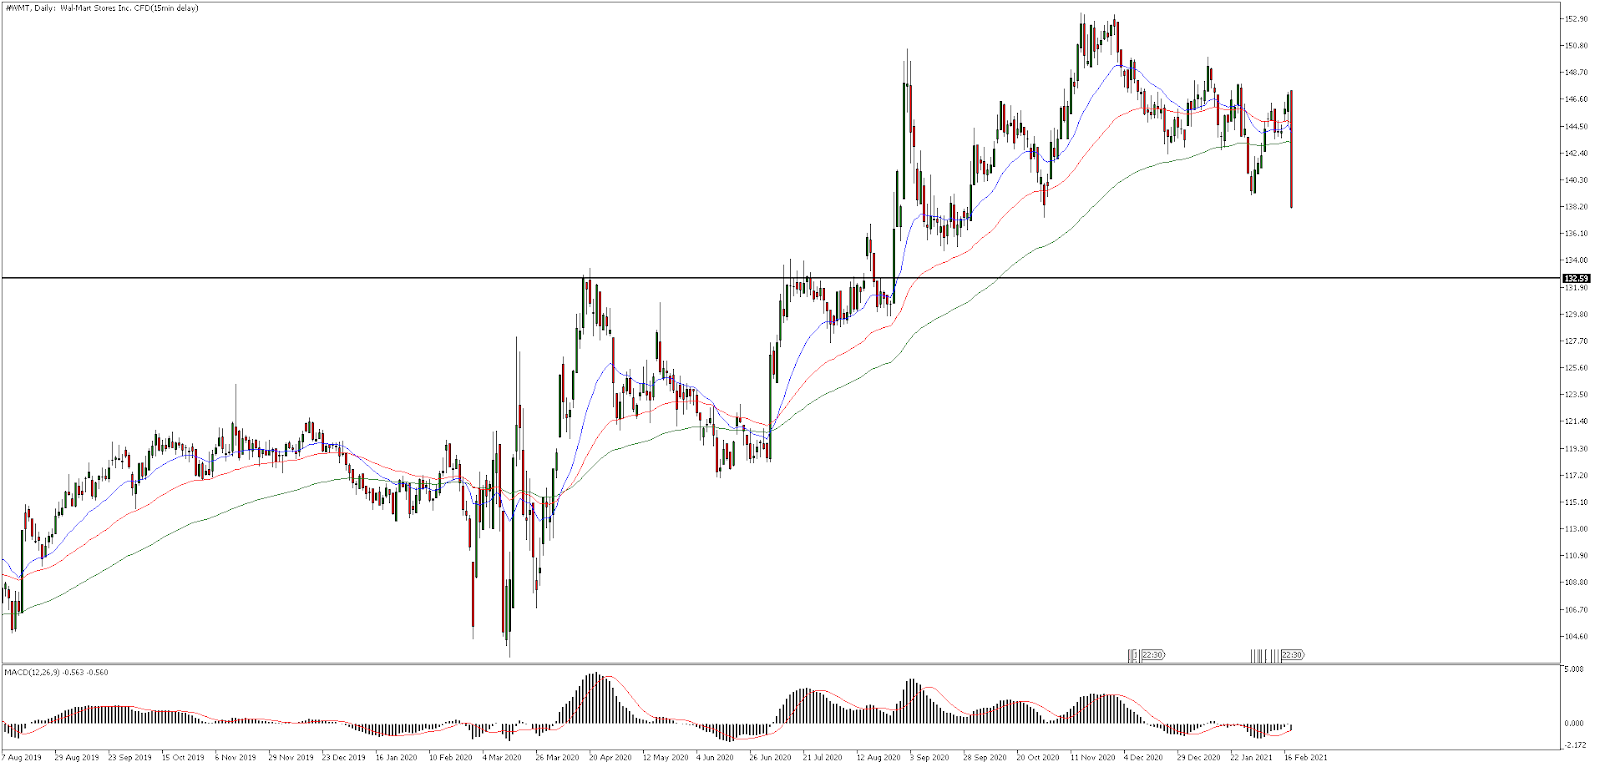 Source: Admiral Markets MetaTrader 5, #WMT, Daily – Data range: from Aug 7, 2019, to Feb 18, 2021, performed on Feb 18, 2021, at 8:35 pm GMT. Please note: Past performance is not a reliable indicator of future results.
In the daily chart above of Walmart’s share price it’s clear to see the large one-day drop yesterday. Now that sellers are firmly in control, price may move towards the next major horizontal support line at ~$132.
Did you know that you can use the Trading Central Technical Ideas Lookup indicator to find actionable trading ideas on this index and thousands of other instruments across Forex, stocks, indices, commodities and more?
You can get this indicator completely FREE by upgrading your MetaTrader 5 trading platform provided by Admiral Markets UK Ltd to the exclusive Admiral Markets Supreme Edition! You’ll also receive a whole range of advanced trading tools such as correlation and sentiment indicators!
Start your free download by clicking on the banner below:

INFORMATION ABOUT ANALYTICAL MATERIALS:
The given data provides additional information regarding all analysis, estimates, prognosis, forecasts, market reviews, weekly outlooks or other similar assessments or information (hereinafter “Analysis”) published on the websites of Admiral Markets investment firms operating under the Admiral Markets trademark (hereinafter “Admiral Markets”) Before making any investment decisions please pay close attention to the following:
- This is a marketing communication. The content is published for informative purposes only and is in no way to be construed as investment advice or recommendation. It has not been prepared in accordance with legal requirements designed to promote the independence of investment research, and that it is not subject to any prohibition on dealing ahead of the dissemination of investment research.
- Any investment decision is made by each client alone whereas Admiral Markets shall not be responsible for any loss or damage arising from any such decision, whether or not based on the content.
- With view to protecting the interests of our clients and the objectivity of the Analysis, Admiral Markets has established relevant internal procedures for prevention and management of conflicts of interest.
- The Analysis is prepared by an independent analyst, Jitan Solanki (analyst), (hereinafter “Author”) based on their personal estimations.
- Whilst every reasonable effort is taken to ensure that all sources of the content are reliable and that all information is presented, as much as possible, in an understandable, timely, precise and complete manner, Admiral Markets does not guarantee the accuracy or completeness of any information contained within the Analysis.
- Any kind of past or modeled performance of financial instruments indicated within the content should not be construed as an express or implied promise, guarantee or implication by Admiral Markets for any future performance. The value of the financial instrument may both increase and decrease and the preservation of the asset value is not guaranteed.
- Leveraged products (including contracts for difference) are speculative in nature and may result in losses or profit. Before you start trading, please ensure that you fully understand the risks involved.

- Target Thursdays: NAS100, Robusta Coffee, USDCHF Apr 25, 2024
- QCOM wants to create competition in the AI chip market. Hong Kong index hits five-month high Apr 25, 2024
- Japanese yen hits all-time low as BoJ meeting commences Apr 25, 2024
- TSLA shares rose on a weak report. Inflationary pressures are easing in Australia Apr 24, 2024
- USDJPY: On intervention watch Apr 24, 2024
- Euro gains against the dollar amid mixed economic signals Apr 24, 2024
- PMI data is the focus of investors’ attention today. Turkey, Iraq, Qatar, and UAE signed a transportation agreement Apr 23, 2024
- Australian dollar rises on strong economic indicators Apr 23, 2024
- Geopolitical risks in the Middle East are declining. China kept interest rates at lows Apr 22, 2024
- Brent crude dips to four-week low amid easing geopolitical tensions Apr 22, 2024