
Since breaking horizontal resistance around the 1,386.00 price level in 2019, gold has been on a meteoric rise higher. In fact, from that date, gold surged more than 50% higher towards the 2,076.00 price level. Since then, the price of gold has been in a steady decline as investors favoured the stock market, helping to lift them to all-time highs.
To add further pain, gold is about to enter a seasonally bearish period. Over the past five years, the monthly price of gold has closed lower than where it opened 80% of the time in February. The resurgence of the US dollar hasn’t helped gold’s case either, suggesting more pain could be ahead.

Source: Admiral Markets MetaTrader 5, GOLD, Weekly – Data range: from Oct 20, 2013, to Feb 4, 2021, performed on Feb 4, 2021, at 8:30 pm GMT. Please note: Past performance is not a reliable indicator of future results.
Free Reports:
 Get our Weekly Commitment of Traders Reports - See where the biggest traders (Hedge Funds and Commercial Hedgers) are positioned in the futures markets on a weekly basis.
 Sign Up for Our Stock Market Newsletter – Get updated on News, Charts & Rankings of Public Companies when you join our Stocks Newsletter
In the above weekly chart of gold, it’s clear to see the break higher from horizontal resistance in June 2019. After topping out in August 2020, gold has steadily declined and is now sitting on the 50-period exponential moving average (ema) shown by the red wavy line.
This moving average provided support for buyers in April 2019 and in March 2020. Buyers also stepped in briefly from this moving average in late November 2020. However, the bounce higher has been muted and the price is now back at the level.
A clear sustained break of this level may be possible if the US dollar continues to rally higher. If so, traders may keep an eye on the next level of support which is the 100-period exponential moving average shown by the green wavy line.
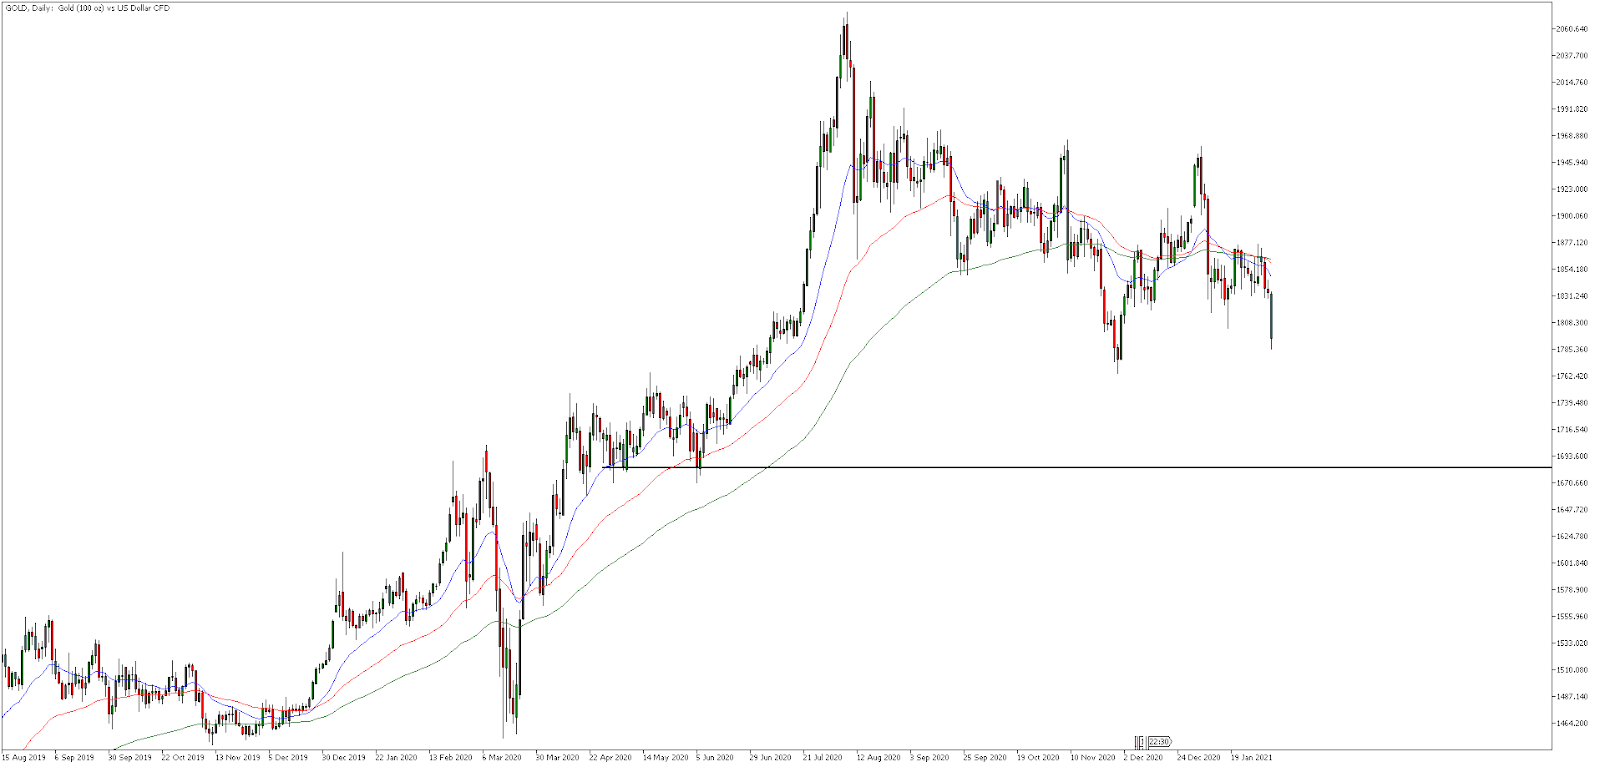
Source: Admiral Markets MetaTrader 5, GOLD, Daily – Data range: from Aug 15, 2019, to Feb 4, 2021, performed on Feb 4, 2021, at 8:40 pm GMT. Please note: Past performance is not a reliable indicator of future results.
In the above daily price chart of gold, the 100-period exponential moving average from the weekly chart is represented by the black horizontal line. This chart shows how much space there is to room towards that level if it can break the weekly 50ema.
The daily chart moving averages have been congested recently and have also moved sideways. However, as they are now starting to fan apart it could be an early warning sign of higher volatility coming in. A drop to the weekly 100ema would amount to an approximate 5-6% fall.
Did you know that you can use the Trading Central Technical Ideas Lookup indicator to find actionable trading ideas on this index and thousands of other instruments across Forex, stocks, indices, commodities and more?
You can get this indicator completely FREE by upgrading your MetaTrader 5 trading platform provided by Admiral Markets UK Ltd to the exclusive Admiral Markets Supreme Edition! You’ll also receive a whole range of advanced trading tools such as correlation and sentiment indicators!
Start your free download by clicking on the banner below:

INFORMATION ABOUT ANALYTICAL MATERIALS:
The given data provides additional information regarding all analysis, estimates, prognosis, forecasts, market reviews, weekly outlooks or other similar assessments or information (hereinafter “Analysis”) published on the websites of Admiral Markets investment firms operating under the Admiral Markets trademark (hereinafter “Admiral Markets”) Before making any investment decisions please pay close attention to the following:
- This is a marketing communication. The content is published for informative purposes only and is in no way to be construed as investment advice or recommendation. It has not been prepared in accordance with legal requirements designed to promote the independence of investment research, and that it is not subject to any prohibition on dealing ahead of the dissemination of investment research.
- Any investment decision is made by each client alone whereas Admiral Markets shall not be responsible for any loss or damage arising from any such decision, whether or not based on the content.
- With view to protecting the interests of our clients and the objectivity of the Analysis, Admiral Markets has established relevant internal procedures for prevention and management of conflicts of interest.
- The Analysis is prepared by an independent analyst, Jitan Solanki (analyst), (hereinafter “Author”) based on their personal estimations.
- Whilst every reasonable effort is taken to ensure that all sources of the content are reliable and that all information is presented, as much as possible, in an understandable, timely, precise and complete manner, Admiral Markets does not guarantee the accuracy or completeness of any information contained within the Analysis.
- Any kind of past or modeled performance of financial instruments indicated within the content should not be construed as an express or implied promise, guarantee or implication by Admiral Markets for any future performance. The value of the financial instrument may both increase and decrease and the preservation of the asset value is not guaranteed.
- Leveraged products (including contracts for difference) are speculative in nature and may result in losses or profit. Before you start trading, please ensure that you fully understand the risks involved.

- Target Thursdays: NAS100, Robusta Coffee, USDCHF Apr 25, 2024
- QCOM wants to create competition in the AI chip market. Hong Kong index hits five-month high Apr 25, 2024
- Japanese yen hits all-time low as BoJ meeting commences Apr 25, 2024
- TSLA shares rose on a weak report. Inflationary pressures are easing in Australia Apr 24, 2024
- USDJPY: On intervention watch Apr 24, 2024
- Euro gains against the dollar amid mixed economic signals Apr 24, 2024
- PMI data is the focus of investors’ attention today. Turkey, Iraq, Qatar, and UAE signed a transportation agreement Apr 23, 2024
- Australian dollar rises on strong economic indicators Apr 23, 2024
- Geopolitical risks in the Middle East are declining. China kept interest rates at lows Apr 22, 2024
- Brent crude dips to four-week low amid easing geopolitical tensions Apr 22, 2024