
Apple’s share price has rallied nearly 100% higher since the beginning of 2020. However, this year has been tough for big tech companies such as the FAANG collective (Facebook, Apple, Amazon, Netflix, Google) which have all struggled to push higher.
Of course, the long-term uptrend in Apple’s share price is undeniable so trading against it needs caution. However, the monthly chart of the company’s share price below does show it is fairly overextended from the 20-period exponential moving average (blue line).
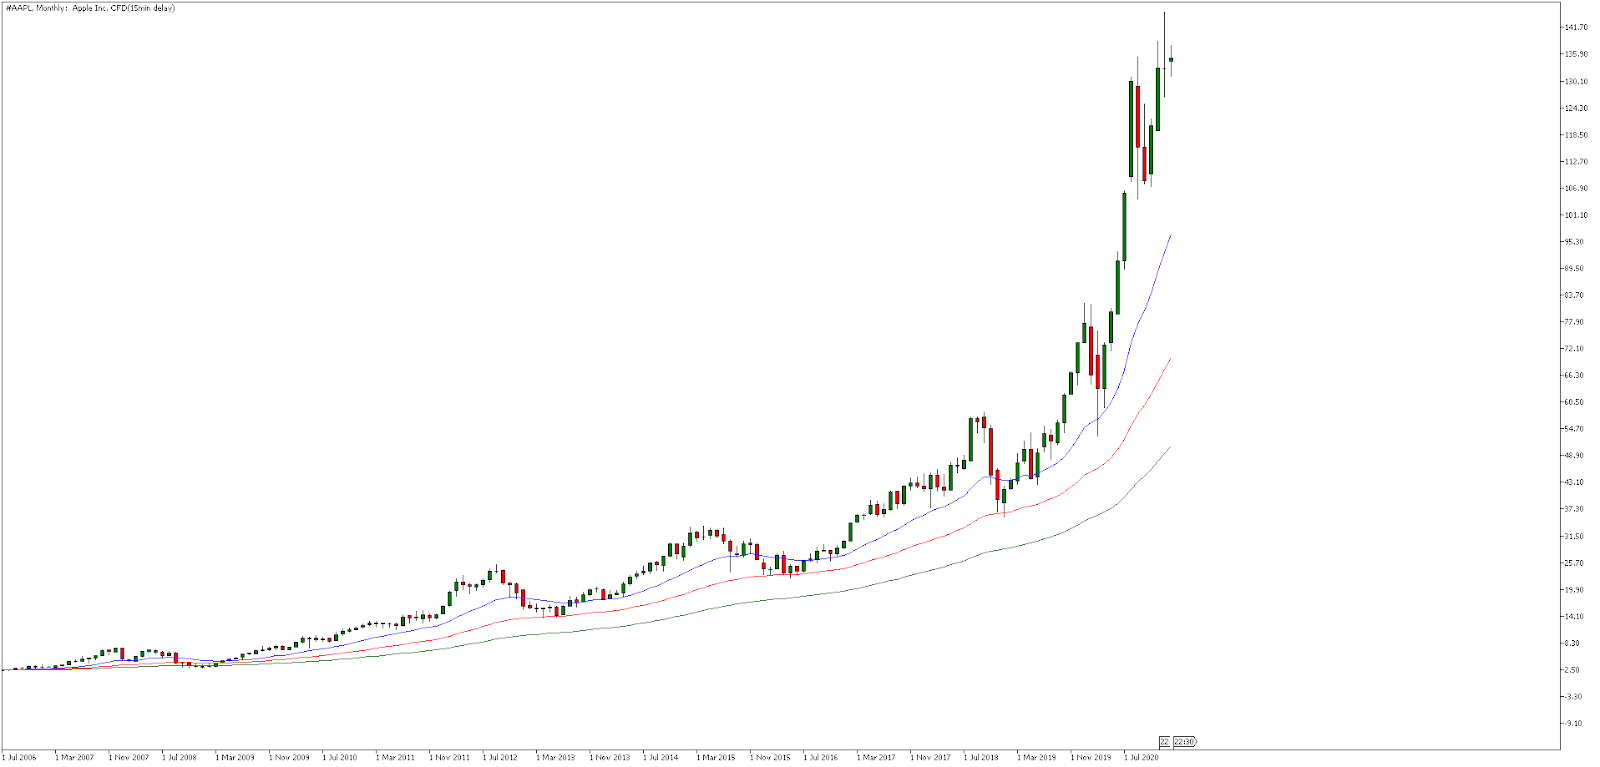
Source: Admiral Markets MetaTrader 5, #AAPL, Monthly – Data range: from Jul 1, 2006, to Feb 11, 2021, performed on Feb 11, 2021, at 8:30 pm GMT. Please note: Past performance is not a reliable indicator of future results.
Free Reports:
 Get our Weekly Commitment of Traders Reports - See where the biggest traders (Hedge Funds and Commercial Hedgers) are positioned in the futures markets on a weekly basis.
 Download Our Metatrader 4 Indicators – Put Our Free MetaTrader 4 Custom Indicators on your charts when you join our Weekly Newsletter
However, the weekly chart below shows that buyers have struggled to stay above the $135.00 price level. In fact, this shows a triple-top chart pattern as the price is now below it after failing to break above it and continue to trend three times before. This could be seen as a bearish sign, or at least the lack of momentum to the upside.
Furthermore, the MACD oscillator is showing bearish divergence. This is when the price has made a higher high cycle but the MACD has not followed and makes a lower high. This suggests the recent move higher has been lacking momentum and some would take this is a bearish sign with the possibility of weakness ahead.
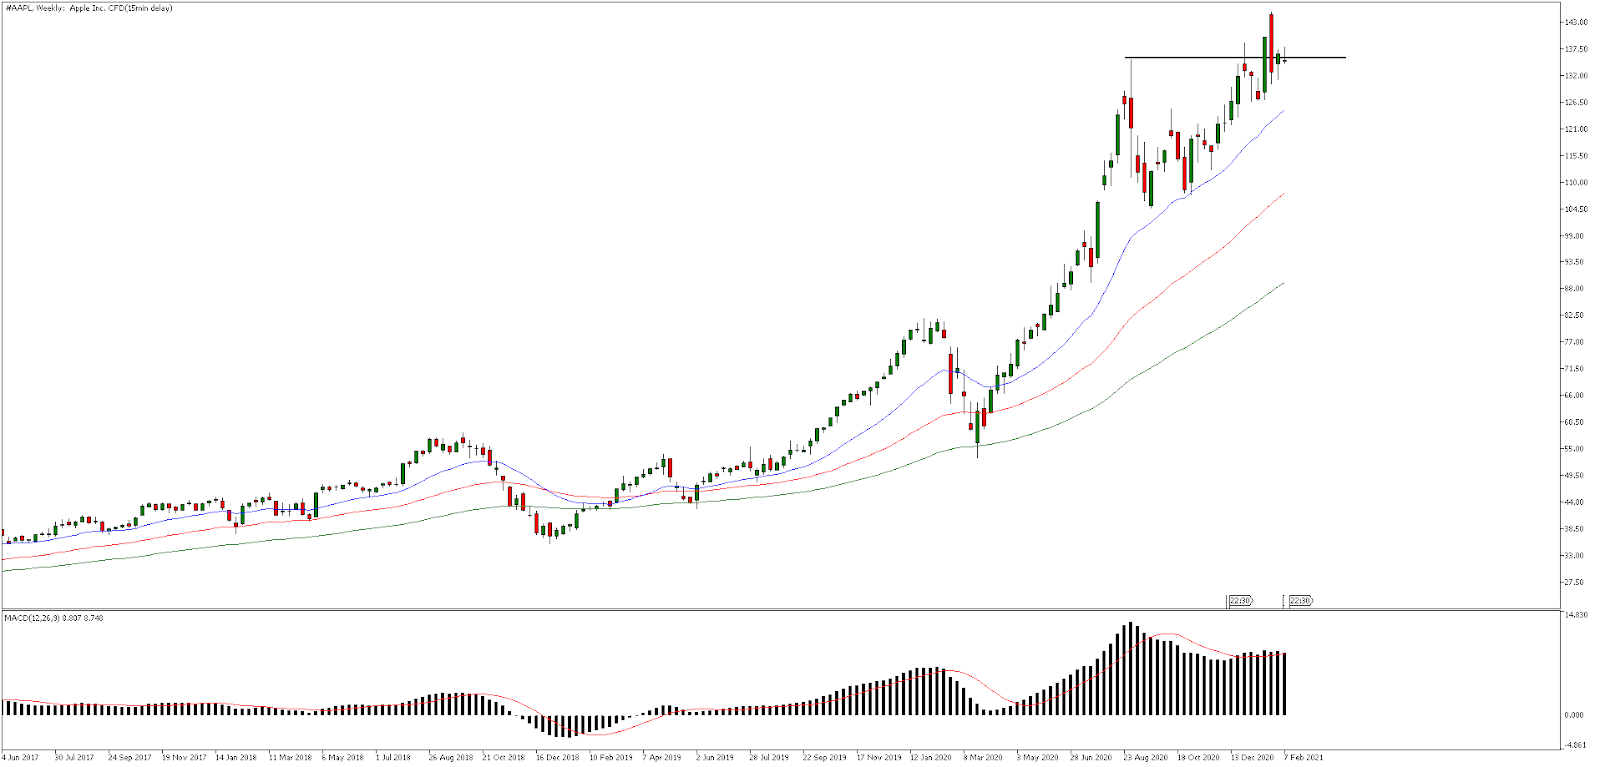
Source: Admiral Markets MetaTrader 5, #AAPL, Weekly – Data range: from Jun 4, 2017, to Feb 11, 2021, performed on Feb 11, 2021, at 8:35 pm GMT. Please note: Past performance is not a reliable indicator of future results.
If price did weaken, where could it go? The daily chart below shows a sideways range has developed in the stock price. A failed break to the upside, suggests the market could fall and test the other side of the range which is around the $106.00 price level.
This level marks the beginning of the recent higher high and higher low cycle upwards and would represent a near 30% correction in the stock price from the highs. To put that into perspective, the stock fell around 35% during the coronavirus pandemic so it may not repeat that unless there was a fundamental reason behind it.
Of course, most traders will be trying to stick with the trend and if price can stay above the horizontal resistance level of around $135.00, where the triple top has formed, then buyers may resume purchasing this much-loved stock!
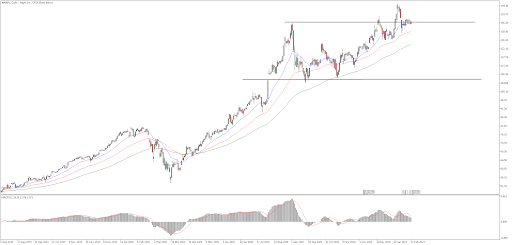
Source: Admiral Markets MetaTrader 5, #AAPL, Daily – Data range: from Aug 5, 2019, to Feb 11, 2021, performed on Feb 11, 2021, at 8:40 pm GMT. Please note: Past performance is not a reliable indicator of future results.
Did you know that you can use the Trading Central Technical Ideas Lookup indicator to find actionable trading ideas on this index and thousands of other instruments across Forex, stocks, indices, commodities and more?
You can get this indicator completely FREE by upgrading your MetaTrader 5 trading platform provided by Admiral Markets UK Ltd to the exclusive Admiral Markets Supreme Edition! You’ll also receive a whole range of advanced trading tools such as correlation and sentiment indicators!
Start your free download by clicking on the banner below:
INFORMATION ABOUT ANALYTICAL MATERIALS:
The given data provides additional information regarding all analysis, estimates, prognosis, forecasts, market reviews, weekly outlooks or other similar assessments or information (hereinafter “Analysis”) published on the websites of Admiral Markets investment firms operating under the Admiral Markets trademark (hereinafter “Admiral Markets”) Before making any investment decisions please pay close attention to the following:
- This is a marketing communication. The content is published for informative purposes only and is in no way to be construed as investment advice or recommendation. It has not been prepared in accordance with legal requirements designed to promote the independence of investment research, and that it is not subject to any prohibition on dealing ahead of the dissemination of investment research.
- Any investment decision is made by each client alone whereas Admiral Markets shall not be responsible for any loss or damage arising from any such decision, whether or not based on the content.
- With view to protecting the interests of our clients and the objectivity of the Analysis, Admiral Markets has established relevant internal procedures for prevention and management of conflicts of interest.
- The Analysis is prepared by an independent analyst, Jitan Solanki (analyst), (hereinafter “Author”) based on their personal estimations.
- Whilst every reasonable effort is taken to ensure that all sources of the content are reliable and that all information is presented, as much as possible, in an understandable, timely, precise and complete manner, Admiral Markets does not guarantee the accuracy or completeness of any information contained within the Analysis.
- Any kind of past or modeled performance of financial instruments indicated within the content should not be construed as an express or implied promise, guarantee or implication by Admiral Markets for any future performance. The value of the financial instrument may both increase and decrease and the preservation of the asset value is not guaranteed.
- Leveraged products (including contracts for difference) are speculative in nature and may result in losses or profit. Before you start trading, please ensure that you fully understand the risks involved.

- 3 Signs of Developing U.S. Economic Slowdown Apr 19, 2024
- Israel has retaliated against Iran. Investors run to safe assets Apr 19, 2024
- Gold hits record high amid growing geopolitical tensions Apr 19, 2024
- The US natural gas prices fell to a 2-month low. A drop in the technology sector on Wednesday had a negative impact on the broad market Apr 18, 2024
- Target Thursdays: Cocoa, Bitcoin and USDCHF hit targets! Apr 18, 2024
- British Pound shows signs of recovery amid favourable inflation data Apr 18, 2024
- Indices decline amid hawkish comments from the Fed. Investors are waiting for Israel’s answer Apr 17, 2024
- EURGBP: Slams into support on hot UK inflation Apr 17, 2024
- Brent crude prices dip amid concerns over global demand Apr 17, 2024
- Stock indices sell-off amid rising geopolitical tensions in the Middle East. China’s GDP grew the most in a year Apr 16, 2024