
By Dmitriy Gurkovskiy, Chief Analyst at RoboForex
The Brent price has been updating its 12-month highs on an almost daily basis. On Monday, February 8th, the asset is trading at $59.95 and hopes to keep its positive momentum.
The key trigger for the oil price growth is expectations of vaccination efficiency. The market is “gambling” on a soon recovery of the world’s key economies, thus increasing the global demand for energies.
At the same time, bulls in oil are totally ignoring the Lunar New Year holidays in China. As a rule, during this period of time, requirements for energies in China, which is the world’s largest importer of the “black gold”, go down and that’s a risk factor for the “overbought” oil.
According to the latest data from Baker Hughes, the Total Rig Count added 8 units and now equals 392, which is quite a good result. The 2020 low was 172 units and that was a pretty bearish factor.
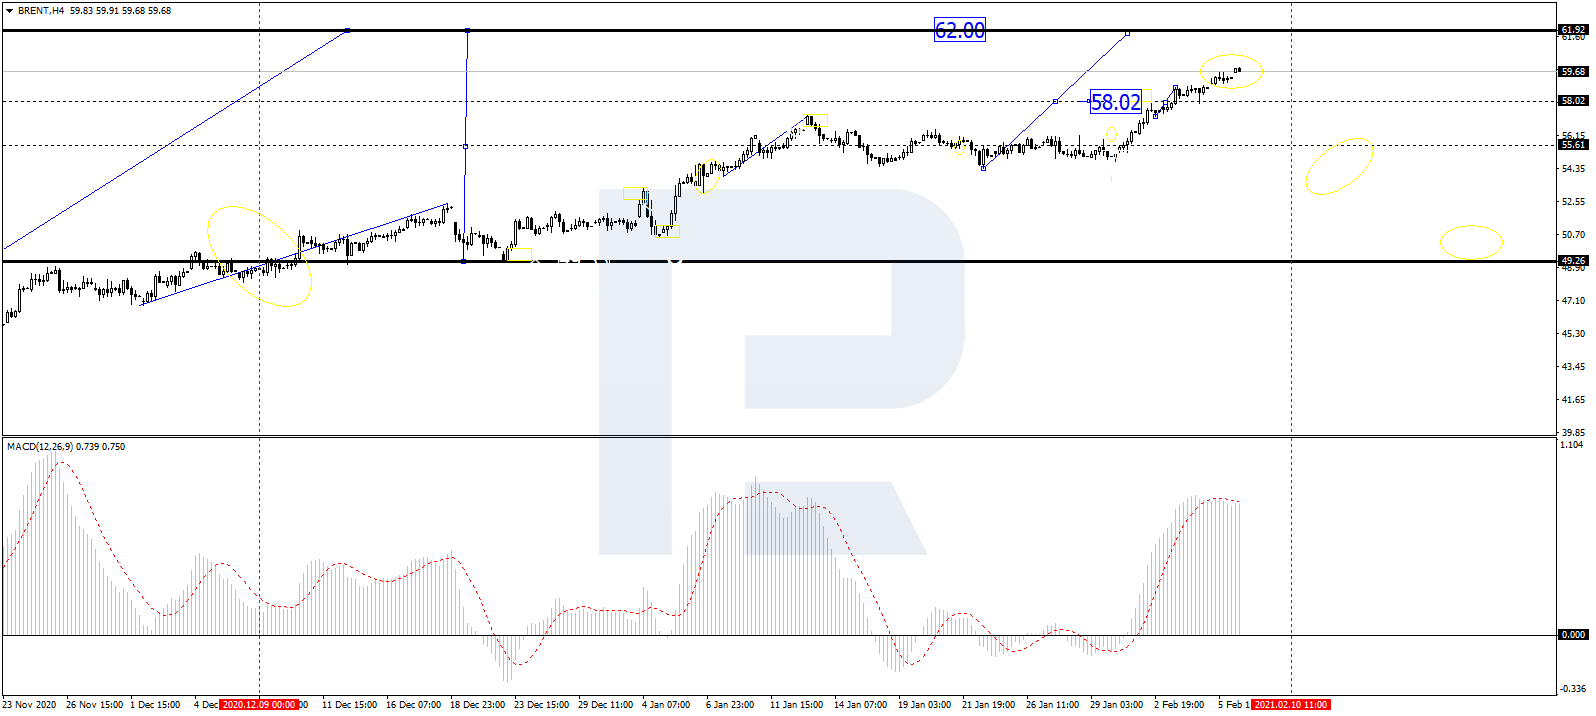
In the H4 chart, after reaching 58.00 and forming a new consolidation range there, Brent has broken it to the upside; right now, it is still moving upwards with the closest target at 62.00. After that, the instrument may start another correction to reach 58.00. From the technical point of view, this scenario is confirmed by MACD Oscillator: its signal line is moving near the highs, entering the histogram area one second and leaving it the next. After the price reaches 62.00, the line is expected to resume falling towards 0.
Free Reports:
 Download Our Metatrader 4 Indicators – Put Our Free MetaTrader 4 Custom Indicators on your charts when you join our Weekly Newsletter
 Get our Weekly Commitment of Traders Reports - See where the biggest traders (Hedge Funds and Commercial Hedgers) are positioned in the futures markets on a weekly basis.
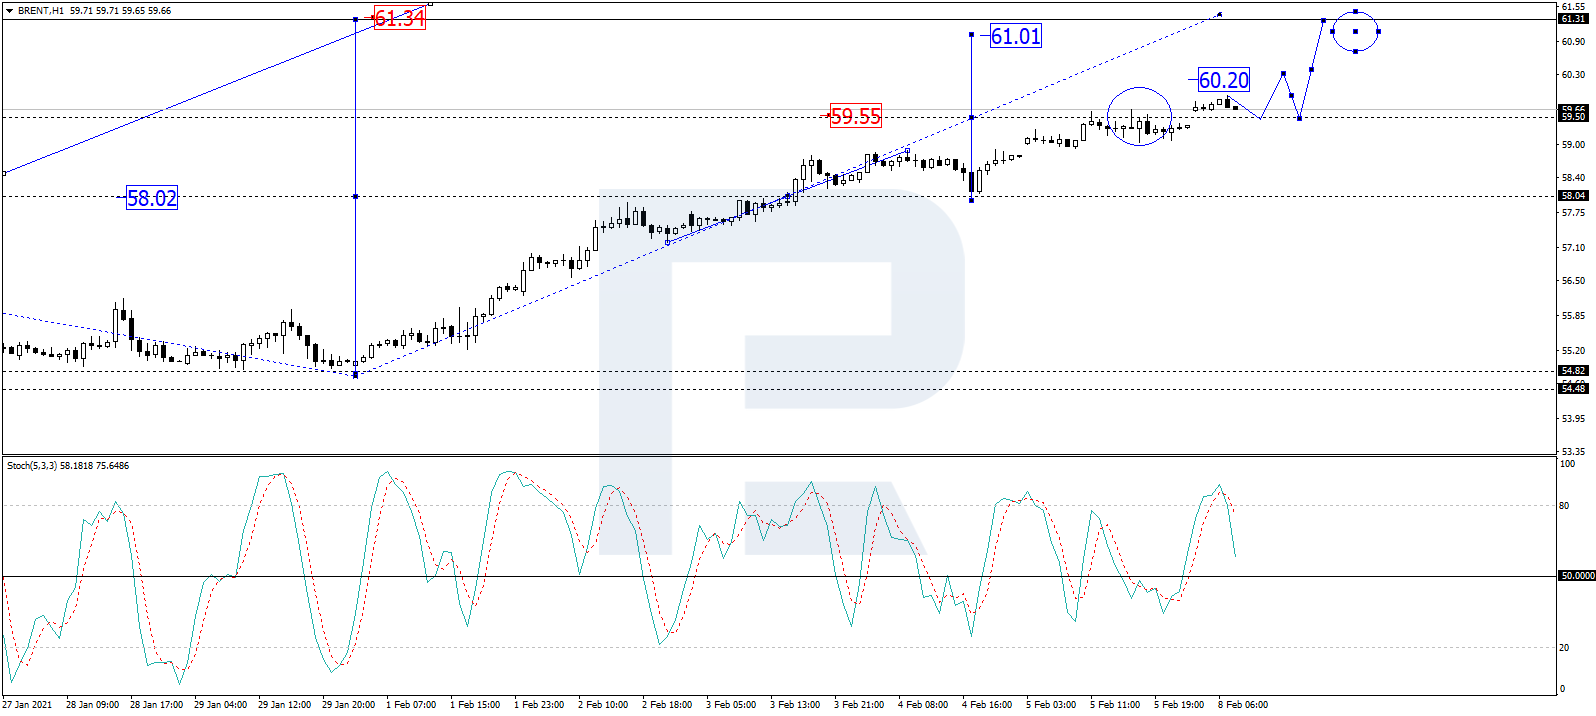
As we can see in the H1 chart, after completing the ascending wave at 59.50 and breaking this level to the upside, Brent has reached 59.90. Today, the asset may fall to test 59.50 from above and then resume growing with the target at 60.20. From the technical point of view, this idea is confirmed by the Stochastic Oscillator: its signal line is moving to break 80 to the downside, which means that the market is trading within the “overbought area” and may start a new descending correction towards 50.
Disclaimer
Any forecasts contained herein are based on the author’s particular opinion. This analysis may not be treated as trading advice. RoboForex bears no responsibility for trading results based on trading recommendations and reviews contained herein.

- Israel has retaliated against Iran. Investors run to safe assets Apr 19, 2024
- Gold hits record high amid growing geopolitical tensions Apr 19, 2024
- The US natural gas prices fell to a 2-month low. A drop in the technology sector on Wednesday had a negative impact on the broad market Apr 18, 2024
- Target Thursdays: Cocoa, Bitcoin and USDCHF hit targets! Apr 18, 2024
- British Pound shows signs of recovery amid favourable inflation data Apr 18, 2024
- Indices decline amid hawkish comments from the Fed. Investors are waiting for Israel’s answer Apr 17, 2024
- EURGBP: Slams into support on hot UK inflation Apr 17, 2024
- Brent crude prices dip amid concerns over global demand Apr 17, 2024
- Stock indices sell-off amid rising geopolitical tensions in the Middle East. China’s GDP grew the most in a year Apr 16, 2024
- New FXTM commodity hits all-time high! Apr 16, 2024