
By CountingPips.com – Receive our weekly COT Reports by Email
Here are the latest charts and statistics for the Commitment of Traders (COT) data published by the Commodities Futures Trading Commission (CFTC).
The latest COT data is updated through Tuesday February 23 2021 and shows a quick view of how large traders (for-profit speculators and commercial entities) were positioned in the futures markets.
VIX Volatility Futures:
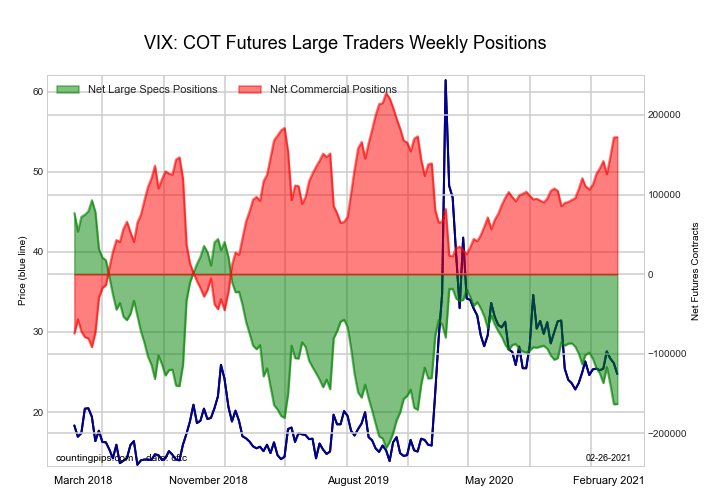
| VIX Volatility Futures Statistics | SPECULATORS | COMMERCIALS | SMALL TRADERS |
| – Percent of Open Interest Longs: | 10.5 | 68.7 | 5.5 |
| – Percent of Open Interest Shorts: | 52.0 | 24.9 | 7.9 |
| – Net Position: | -162,918 | 172,113 | -9,195 |
| – Gross Longs: | 41,074 | 269,767 | 21,727 |
| – Gross Shorts: | 203,992 | 97,654 | 30,922 |
| – Long to Short Ratio: | 0.2 to 1 | 2.8 to 1 | 0.7 to 1 |
| NET POSITION TREND: | |||
| – COT Index Score (3 Year Range Pct): | 17.8 | 82.7 | 21.5 |
| – COT Index Reading (3 Year Range): | Bearish-Extreme | Bullish-Extreme | Bearish |
| NET POSITION MOVEMENT INDEX: | |||
| – 6-Week Change in Strength Index: | -14.6 | 14.5 | -3.7 |
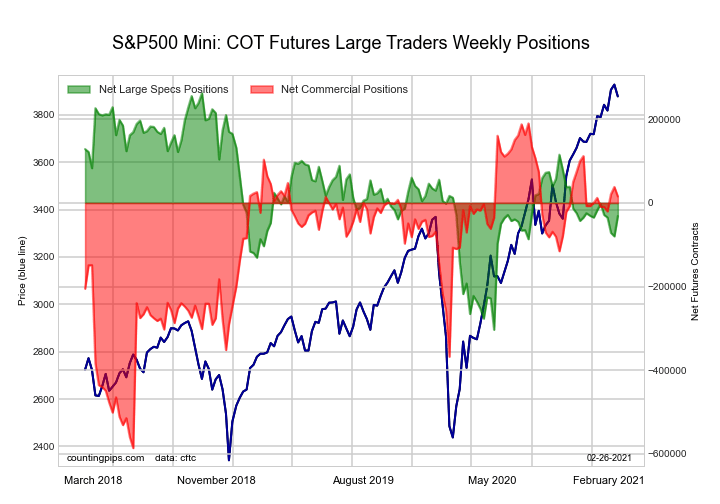
S&P500 Mini Futures:
Free Reports:
 Get our Weekly Commitment of Traders Reports - See where the biggest traders (Hedge Funds and Commercial Hedgers) are positioned in the futures markets on a weekly basis.
 Download Our Metatrader 4 Indicators – Put Our Free MetaTrader 4 Custom Indicators on your charts when you join our Weekly Newsletter
| S&P500 Mini Futures Statistics | SPECULATORS | COMMERCIALS | SMALL TRADERS |
| – Percent of Open Interest Longs: | 13.4 | 74.2 | 10.0 |
| – Percent of Open Interest Shorts: | 14.6 | 73.6 | 9.4 |
| – Net Position: | -31,287 | 15,613 | 15,674 |
| – Gross Longs: | 355,414 | 1,968,877 | 265,663 |
| – Gross Shorts: | 386,701 | 1,953,264 | 249,989 |
| – Long to Short Ratio: | 0.9 to 1 | 1.0 to 1 | 1.1 to 1 |
| NET POSITION TREND: | |||
| – COT Index Score (3 Year Range Pct): | 48.0 | 77.5 | 26.0 |
| – COT Index Reading (3 Year Range): | Bearish | Bullish | Bearish |
| NET POSITION MOVEMENT INDEX: | |||
| – 6-Week Change in Strength Index: | -2.4 | 0.5 | 1.9 |
Dow Jones Mini Futures:
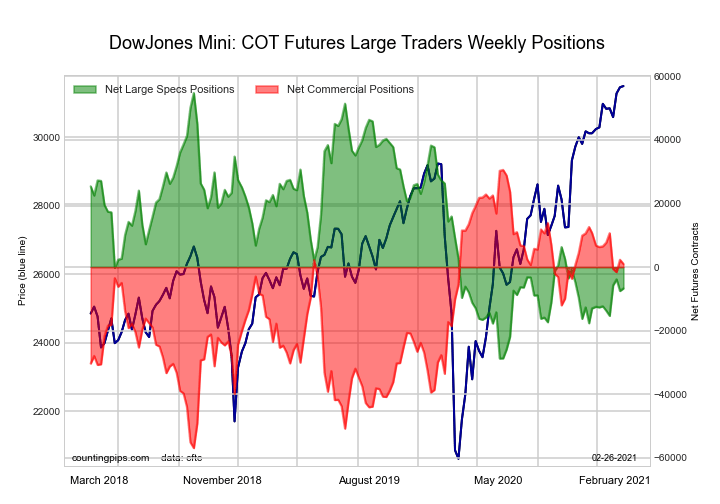
| Dow Jones Mini Futures Statistics | SPECULATORS | COMMERCIALS | SMALL TRADERS |
| – Percent of Open Interest Longs: | 32.1 | 46.5 | 19.5 |
| – Percent of Open Interest Shorts: | 39.3 | 45.4 | 13.3 |
| – Net Position: | -6,707 | 995 | 5,712 |
| – Gross Longs: | 29,519 | 42,799 | 17,927 |
| – Gross Shorts: | 36,226 | 41,804 | 12,215 |
| – Long to Short Ratio: | 0.8 to 1 | 1.0 to 1 | 1.5 to 1 |
| NET POSITION TREND: | |||
| – COT Index Score (3 Year Range Pct): | 26.4 | 66.2 | 79.7 |
| – COT Index Reading (3 Year Range): | Bearish | Bullish | Bullish |
| NET POSITION MOVEMENT INDEX: | |||
| – 6-Week Change in Strength Index: | 6.7 | -6.4 | -0.4 |
Nasdaq Mini Futures:
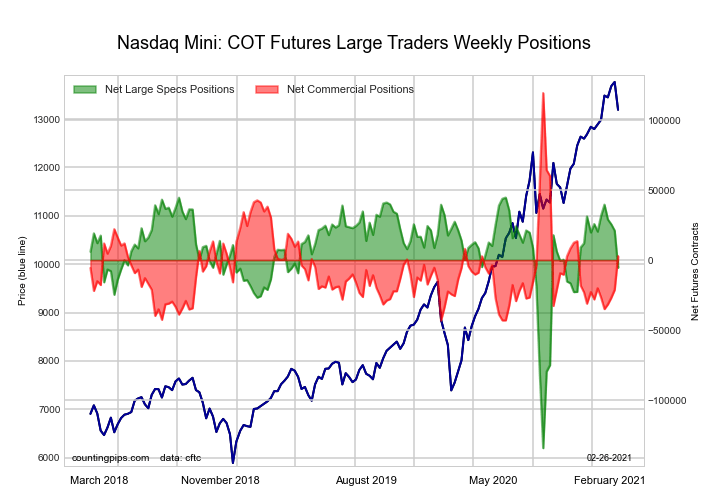
| Nasdaq Mini Futures Statistics | SPECULATORS | COMMERCIALS | SMALL TRADERS |
| – Percent of Open Interest Longs: | 28.1 | 53.9 | 15.9 |
| – Percent of Open Interest Shorts: | 30.4 | 52.6 | 14.9 |
| – Net Position: | -5,388 | 2,899 | 2,489 |
| – Gross Longs: | 67,535 | 129,279 | 38,216 |
| – Gross Shorts: | 72,923 | 126,380 | 35,727 |
| – Long to Short Ratio: | 0.9 to 1 | 1.0 to 1 | 1.1 to 1 |
| NET POSITION TREND: | |||
| – COT Index Score (3 Year Range Pct): | 72.0 | 28.3 | 49.6 |
| – COT Index Reading (3 Year Range): | Bullish | Bearish | Bearish |
| NET POSITION MOVEMENT INDEX: | |||
| – 6-Week Change in Strength Index: | -14.4 | 14.1 | 6.4 |
Russell 2000 Mini Futures:
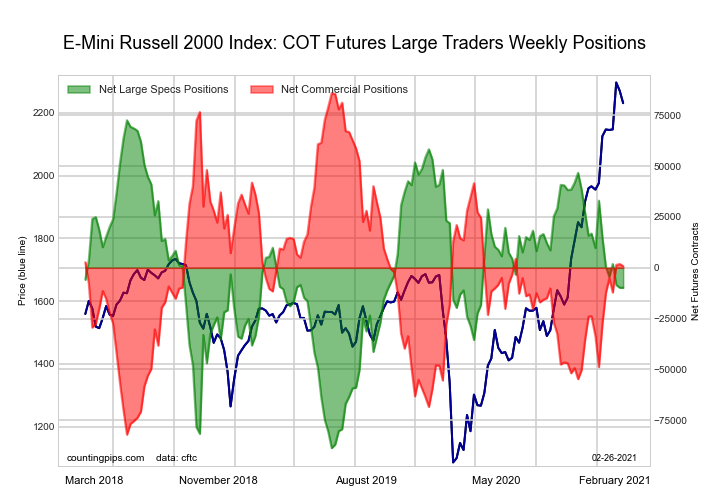
| Russell 2000 Mini Futures Statistics | SPECULATORS | COMMERCIALS | SMALL TRADERS |
| – Percent of Open Interest Longs: | 15.9 | 78.3 | 5.2 |
| – Percent of Open Interest Shorts: | 17.6 | 78.1 | 3.7 |
| – Net Position: | -9,822 | 804 | 9,018 |
| – Gross Longs: | 91,030 | 448,354 | 30,005 |
| – Gross Shorts: | 100,852 | 447,550 | 20,987 |
| – Long to Short Ratio: | 0.9 to 1 | 1.0 to 1 | 1.4 to 1 |
| NET POSITION TREND: | |||
| – COT Index Score (3 Year Range Pct): | 48.9 | 49.3 | 58.5 |
| – COT Index Reading (3 Year Range): | Bearish | Bearish | Bullish |
| NET POSITION MOVEMENT INDEX: | |||
| – 6-Week Change in Strength Index: | -15.4 | 17.0 | -10.5 |
Nikkei Stock Average Futures (USD):

| Nikkei Stock Average Futures Statistics | SPECULATORS | COMMERCIALS | SMALL TRADERS |
| – Percent of Open Interest Longs: | 11.2 | 52.7 | 36.1 |
| – Percent of Open Interest Shorts: | 24.4 | 62.2 | 13.4 |
| – Net Position: | -2,186 | -1,573 | 3,759 |
| – Gross Longs: | 1,846 | 8,713 | 5,976 |
| – Gross Shorts: | 4,032 | 10,286 | 2,217 |
| – Long to Short Ratio: | 0.5 to 1 | 0.8 to 1 | 2.7 to 1 |
| NET POSITION TREND: | |||
| – COT Index Score (3 Year Range Pct): | 46.3 | 48.4 | 63.0 |
| – COT Index Reading (3 Year Range): | Bearish | Bearish | Bullish |
| NET POSITION MOVEMENT INDEX: | |||
| – 6-Week Change in Strength Index: | -3.0 | -11.6 | 52.6 |
MSCI EAFE Mini Futures:
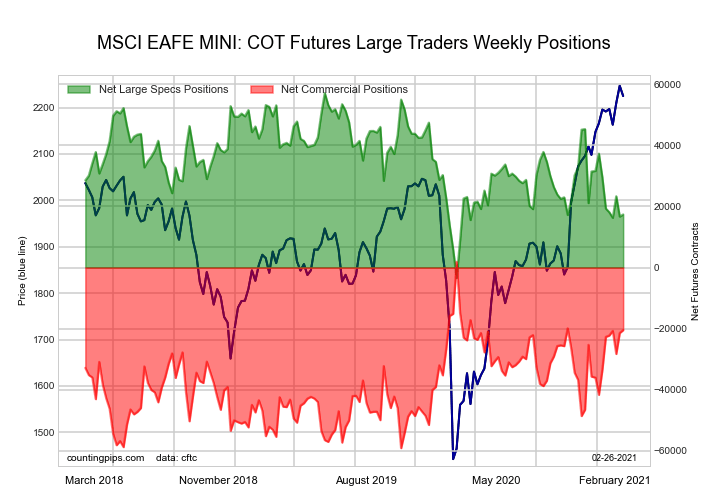
| MSCI EAFE Mini Futures Statistics | SPECULATORS | COMMERCIALS | SMALL TRADERS |
| – Percent of Open Interest Longs: | 8.2 | 89.1 | 2.4 |
| – Percent of Open Interest Shorts: | 4.1 | 93.8 | 1.6 |
| – Net Position: | 17,392 | -20,518 | 3,126 |
| – Gross Longs: | 35,317 | 385,605 | 10,184 |
| – Gross Shorts: | 17,925 | 406,123 | 7,058 |
| – Long to Short Ratio: | 2.0 to 1 | 0.9 to 1 | 1.4 to 1 |
| NET POSITION TREND: | |||
| – COT Index Score (3 Year Range Pct): | 34.3 | 63.3 | 44.2 |
| – COT Index Reading (3 Year Range): | Bearish | Bullish | Bearish |
| NET POSITION MOVEMENT INDEX: | |||
| – 6-Week Change in Strength Index: | -20.0 | 21.3 | -8.3 |
MSCI Emerging Mkts Mini Futures:
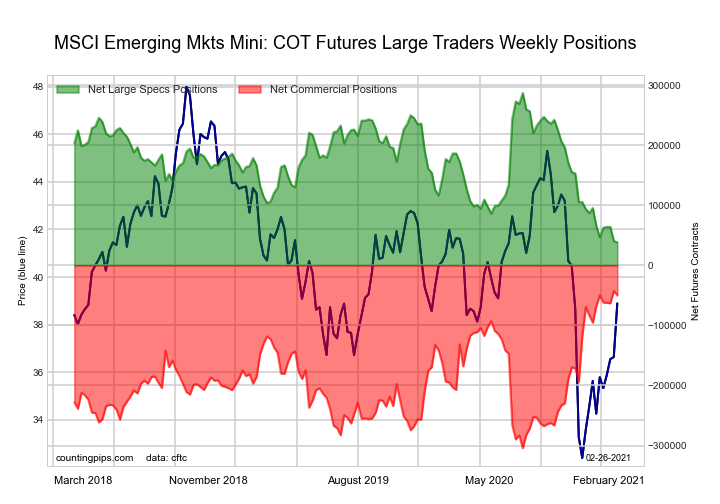
| MSCI Emerging Mkts Mini Futures Statistics | SPECULATORS | COMMERCIALS | SMALL TRADERS |
| – Percent of Open Interest Longs: | 14.3 | 82.2 | 2.4 |
| – Percent of Open Interest Shorts: | 11.0 | 86.5 | 1.3 |
| – Net Position: | 38,211 | -49,886 | 11,675 |
| – Gross Longs: | 165,150 | 950,685 | 27,250 |
| – Gross Shorts: | 126,939 | 1,000,571 | 15,575 |
| – Long to Short Ratio: | 1.3 to 1 | 1.0 to 1 | 1.7 to 1 |
| NET POSITION TREND: | |||
| – COT Index Score (3 Year Range Pct): | 0.0 | 97.2 | 40.4 |
| – COT Index Reading (3 Year Range): | Bearish-Extreme | Bullish-Extreme | Bearish |
| NET POSITION MOVEMENT INDEX: | |||
| – 6-Week Change in Strength Index: | -11.0 | 6.8 | 7.3 |
Article By CountingPips.com – Receive our weekly COT Reports by Email
*COT Report: The COT data, released weekly to the public each Friday, is updated through the most recent Tuesday (data is 3 days old) and shows a quick view of how large speculators or non-commercials (for-profit traders) were positioned in the futures markets.
The CFTC categorizes trader positions according to commercial hedgers (traders who use futures contracts for hedging as part of the business), non-commercials (large traders who speculate to realize trading profits) and nonreportable traders (usually small traders/speculators).
Find CFTC criteria here: (http://www.cftc.gov/MarketReports/CommitmentsofTraders/ExplanatoryNotes/index.htm).

- FastSpring and EBANX Forge Partnership to Expand Pix Payments for Digital Products in Brazil Apr 25, 2024
- Target Thursdays: NAS100, Robusta Coffee, USDCHF Apr 25, 2024
- QCOM wants to create competition in the AI chip market. Hong Kong index hits five-month high Apr 25, 2024
- Japanese yen hits all-time low as BoJ meeting commences Apr 25, 2024
- TSLA shares rose on a weak report. Inflationary pressures are easing in Australia Apr 24, 2024
- USDJPY: On intervention watch Apr 24, 2024
- Euro gains against the dollar amid mixed economic signals Apr 24, 2024
- PMI data is the focus of investors’ attention today. Turkey, Iraq, Qatar, and UAE signed a transportation agreement Apr 23, 2024
- Australian dollar rises on strong economic indicators Apr 23, 2024
- Geopolitical risks in the Middle East are declining. China kept interest rates at lows Apr 22, 2024