
By CountingPips.com – Receive our weekly COT Reports by Email
Here are the latest charts and statistics for the Commitment of Traders (COT) data published by the Commodities Futures Trading Commission (CFTC).
The latest COT data is updated through Tuesday February 23 2021 and shows a quick view of how large traders (for-profit speculators and commercial entities) were positioned in the futures markets.
30-Day Federal Funds:
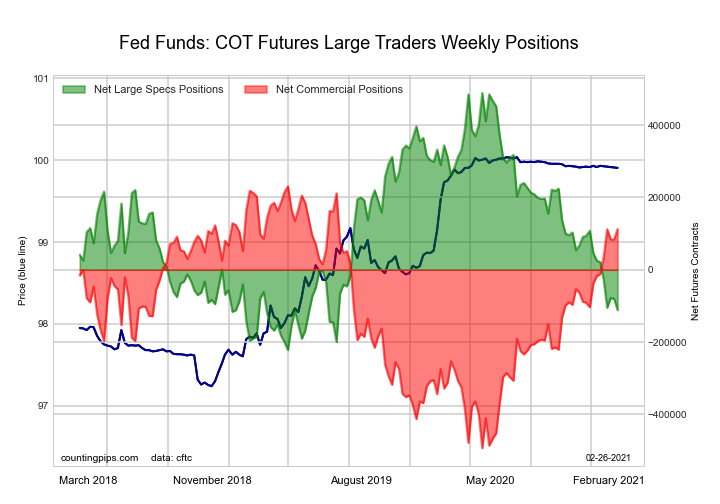
| 30-Day Federal Funds Statistics | SPECULATORS | COMMERCIALS | SMALL TRADERS |
| – Percent of Open Interest Longs: | 8.2 | 72.4 | 1.9 |
| – Percent of Open Interest Shorts: | 17.6 | 62.9 | 2.0 |
| – Net Position: | -111,478 | 112,803 | -1,325 |
| – Gross Longs: | 98,122 | 863,148 | 22,222 |
| – Gross Shorts: | 209,600 | 750,345 | 23,547 |
| – Long to Short Ratio: | 0.5 to 1 | 1.2 to 1 | 0.9 to 1 |
| NET POSITION TREND: | |||
| – COT Index Score (3 Year Range Pct): | 15.5 | 83.7 | 68.7 |
| – COT Index Reading (3 Year Range): | Bearish-Extreme | Bullish-Extreme | Bullish |
| NET POSITION MOVEMENT INDEX: | |||
| – 6-Week Change in Strength Index: | -19.3 | 17.9 | 13.1 |
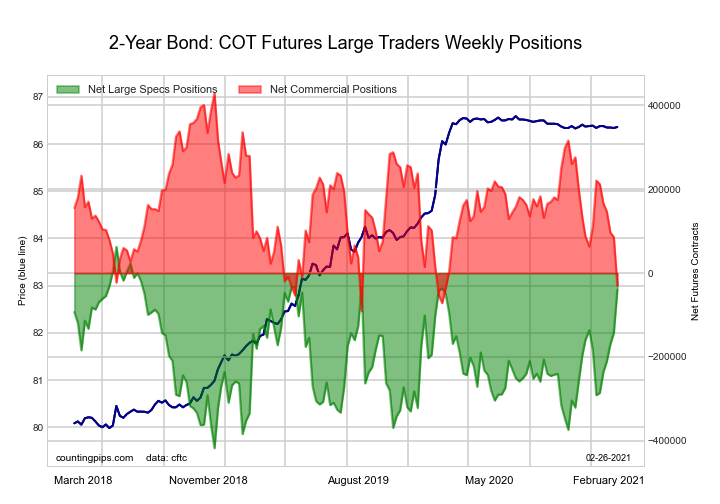
2-Year Treasury Note:
Free Reports:
 Download Our Metatrader 4 Indicators – Put Our Free MetaTrader 4 Custom Indicators on your charts when you join our Weekly Newsletter
 Get our Weekly Commitment of Traders Reports - See where the biggest traders (Hedge Funds and Commercial Hedgers) are positioned in the futures markets on a weekly basis.
| 2-Year Treasury Note Statistics | SPECULATORS | COMMERCIALS | SMALL TRADERS |
| – Percent of Open Interest Longs: | 26.2 | 63.6 | 6.1 |
| – Percent of Open Interest Shorts: | 27.9 | 64.8 | 3.2 |
| – Net Position: | -39,871 | -29,660 | 69,531 |
| – Gross Longs: | 623,688 | 1,512,141 | 145,752 |
| – Gross Shorts: | 663,559 | 1,541,801 | 76,221 |
| – Long to Short Ratio: | 0.9 to 1 | 1.0 to 1 | 1.9 to 1 |
| NET POSITION TREND: | |||
| – COT Index Score (3 Year Range Pct): | 78.6 | 11.7 | 71.6 |
| – COT Index Reading (3 Year Range): | Bullish | Bearish-Extreme | Bullish |
| NET POSITION MOVEMENT INDEX: | |||
| – 6-Week Change in Strength Index: | 52.3 | -48.2 | -0.4 |
5-Year Treasury Note:
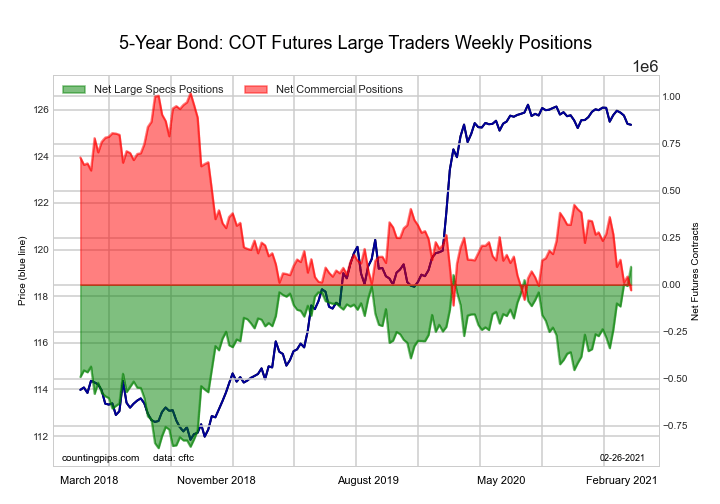
| 5-Year Treasury Note Statistics | SPECULATORS | COMMERCIALS | SMALL TRADERS |
| – Percent of Open Interest Longs: | 22.0 | 61.9 | 8.4 |
| – Percent of Open Interest Shorts: | 19.5 | 62.6 | 10.2 |
| – Net Position: | 95,406 | -29,241 | -66,165 |
| – Gross Longs: | 833,986 | 2,343,372 | 318,667 |
| – Gross Shorts: | 738,580 | 2,372,613 | 384,832 |
| – Long to Short Ratio: | 1.1 to 1 | 1.0 to 1 | 0.8 to 1 |
| NET POSITION TREND: | |||
| – COT Index Score (3 Year Range Pct): | 100.0 | 7.2 | 49.4 |
| – COT Index Reading (3 Year Range): | Bullish-Extreme | Bearish-Extreme | Bearish |
| NET POSITION MOVEMENT INDEX: | |||
| – 6-Week Change in Strength Index: | 44.9 | -34.5 | -16.0 |
10-Year Treasury Note:
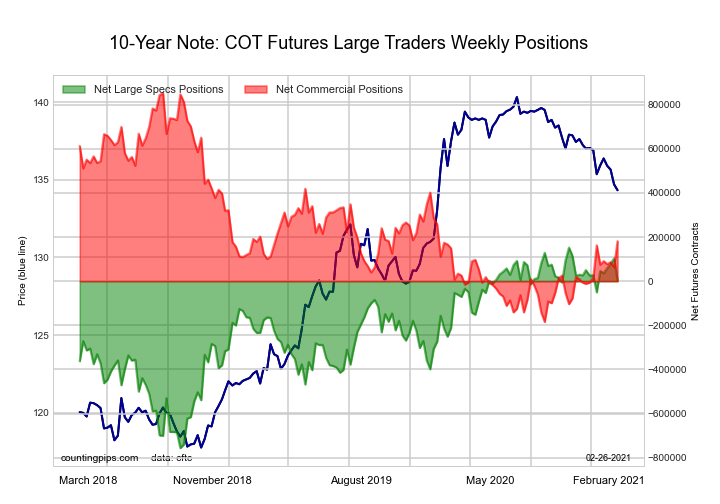
| 10-Year Treasury Note Statistics | SPECULATORS | COMMERCIALS | SMALL TRADERS |
| – Percent of Open Interest Longs: | 15.9 | 64.1 | 10.2 |
| – Percent of Open Interest Shorts: | 15.8 | 59.6 | 14.7 |
| – Net Position: | 2,789 | 181,377 | -184,166 |
| – Gross Longs: | 642,543 | 2,594,445 | 411,118 |
| – Gross Shorts: | 639,754 | 2,413,068 | 595,284 |
| – Long to Short Ratio: | 1.0 to 1 | 1.1 to 1 | 0.7 to 1 |
| NET POSITION TREND: | |||
| – COT Index Score (3 Year Range Pct): | 83.5 | 35.3 | 24.0 |
| – COT Index Reading (3 Year Range): | Bullish-Extreme | Bearish | Bearish |
| NET POSITION MOVEMENT INDEX: | |||
| – 6-Week Change in Strength Index: | 5.8 | 1.8 | -19.8 |
Ultra 10-Year Notes:

| Ultra 10-Year Notes Statistics | SPECULATORS | COMMERCIALS | SMALL TRADERS |
| – Percent of Open Interest Longs: | 19.0 | 69.0 | 9.9 |
| – Percent of Open Interest Shorts: | 6.2 | 72.4 | 19.2 |
| – Net Position: | 173,188 | -46,157 | -127,031 |
| – Gross Longs: | 258,297 | 940,572 | 135,254 |
| – Gross Shorts: | 85,109 | 986,729 | 262,285 |
| – Long to Short Ratio: | 3.0 to 1 | 1.0 to 1 | 0.5 to 1 |
| NET POSITION TREND: | |||
| – COT Index Score (3 Year Range Pct): | 94.1 | 24.9 | 0.0 |
| – COT Index Reading (3 Year Range): | Bullish-Extreme | Bearish | Bearish-Extreme |
| NET POSITION MOVEMENT INDEX: | |||
| – 6-Week Change in Strength Index: | 14.4 | -2.4 | -34.1 |
US Treasury Bonds:
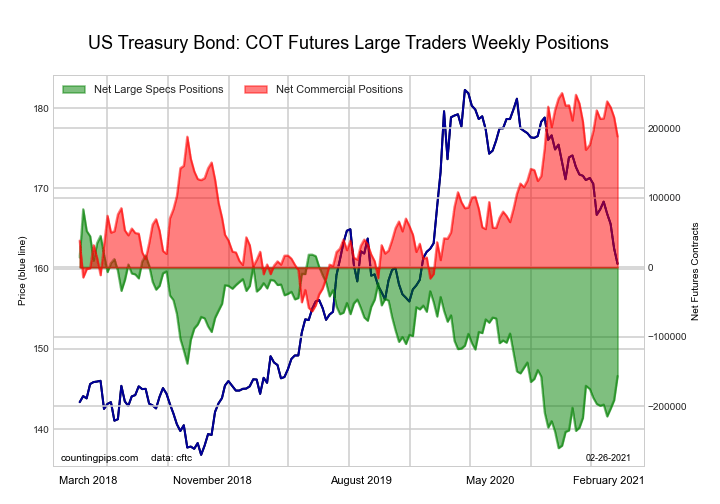
| US Treasury Bonds Statistics | SPECULATORS | COMMERCIALS | SMALL TRADERS |
| – Percent of Open Interest Longs: | 10.4 | 73.2 | 13.8 |
| – Percent of Open Interest Shorts: | 22.9 | 58.1 | 16.3 |
| – Net Position: | -156,309 | 188,155 | -31,846 |
| – Gross Longs: | 129,775 | 914,249 | 172,342 |
| – Gross Shorts: | 286,084 | 726,094 | 204,188 |
| – Long to Short Ratio: | 0.5 to 1 | 1.3 to 1 | 0.8 to 1 |
| NET POSITION TREND: | |||
| – COT Index Score (3 Year Range Pct): | 30.2 | 80.1 | 29.9 |
| – COT Index Reading (3 Year Range): | Bearish | Bullish-Extreme | Bearish |
| NET POSITION MOVEMENT INDEX: | |||
| – 6-Week Change in Strength Index: | 11.7 | -12.0 | -1.9 |
Ultra US Treasury Bonds:
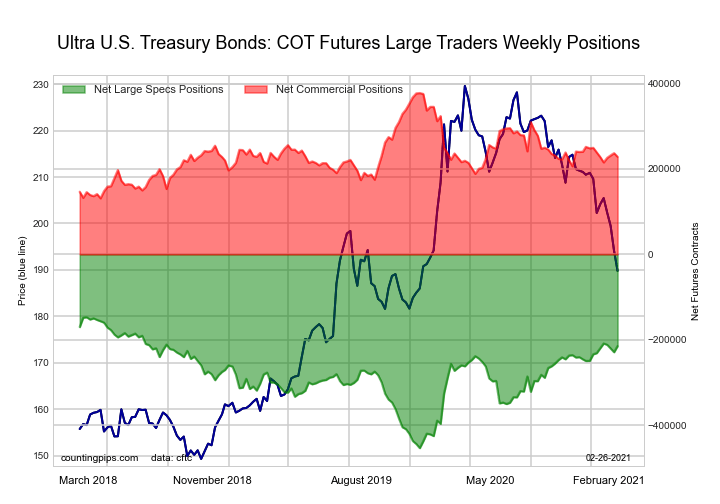
| Ultra US Treasury Bonds Statistics | SPECULATORS | COMMERCIALS | SMALL TRADERS |
| – Percent of Open Interest Longs: | 7.6 | 76.8 | 12.6 |
| – Percent of Open Interest Shorts: | 25.7 | 57.6 | 13.8 |
| – Net Position: | -215,036 | 228,517 | -13,481 |
| – Gross Longs: | 90,156 | 912,983 | 150,059 |
| – Gross Shorts: | 305,192 | 684,466 | 163,540 |
| – Long to Short Ratio: | 0.3 to 1 | 1.3 to 1 | 0.9 to 1 |
| NET POSITION TREND: | |||
| – COT Index Score (3 Year Range Pct): | 77.9 | 39.4 | 1.6 |
| – COT Index Reading (3 Year Range): | Bullish | Bearish | Bearish-Extreme |
| NET POSITION MOVEMENT INDEX: | |||
| – 6-Week Change in Strength Index: | 5.3 | -4.1 | -5.4 |
3-Month Eurodollars:
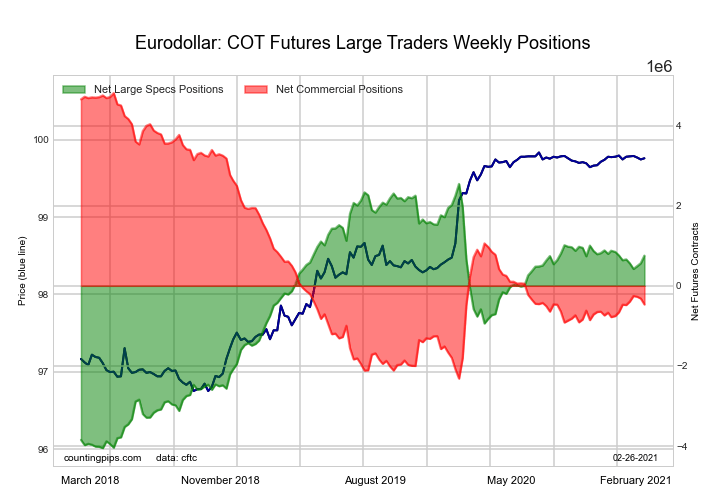
| 3-Month Eurodollars Statistics | SPECULATORS | COMMERCIALS | SMALL TRADERS |
| – Percent of Open Interest Longs: | 20.5 | 48.2 | 4.7 |
| – Percent of Open Interest Shorts: | 14.0 | 52.2 | 7.2 |
| – Net Position: | 752,498 | -465,476 | -287,022 |
| – Gross Longs: | 2,372,370 | 5,575,667 | 543,029 |
| – Gross Shorts: | 1,619,872 | 6,041,143 | 830,051 |
| – Long to Short Ratio: | 1.5 to 1 | 0.9 to 1 | 0.7 to 1 |
| NET POSITION TREND: | |||
| – COT Index Score (3 Year Range Pct): | 72.9 | 26.0 | 66.1 |
| – COT Index Reading (3 Year Range): | Bullish | Bearish | Bullish |
| NET POSITION MOVEMENT INDEX: | |||
| – 6-Week Change in Strength Index: | 1.7 | 0.1 | -15.3 |
Article By CountingPips.com – Receive our weekly COT Reports by Email
*COT Report: The COT data, released weekly to the public each Friday, is updated through the most recent Tuesday (data is 3 days old) and shows a quick view of how large speculators or non-commercials (for-profit traders) were positioned in the futures markets.
The CFTC categorizes trader positions according to commercial hedgers (traders who use futures contracts for hedging as part of the business), non-commercials (large traders who speculate to realize trading profits) and nonreportable traders (usually small traders/speculators).
Find CFTC criteria here: (http://www.cftc.gov/MarketReports/CommitmentsofTraders/ExplanatoryNotes/index.htm).

- The US natural gas prices fell to a 2-month low. A drop in the technology sector on Wednesday had a negative impact on the broad market Apr 18, 2024
- Target Thursdays: Cocoa, Bitcoin and USDCHF hit targets! Apr 18, 2024
- British Pound shows signs of recovery amid favourable inflation data Apr 18, 2024
- Indices decline amid hawkish comments from the Fed. Investors are waiting for Israel’s answer Apr 17, 2024
- EURGBP: Slams into support on hot UK inflation Apr 17, 2024
- Brent crude prices dip amid concerns over global demand Apr 17, 2024
- Stock indices sell-off amid rising geopolitical tensions in the Middle East. China’s GDP grew the most in a year Apr 16, 2024
- New FXTM commodity hits all-time high! Apr 16, 2024
- NZD hits five-month low against strong US dollar Apr 16, 2024
- Escalating conflict in the Middle East is forcing investors to shift funds to safe assets Apr 15, 2024