
Article By RoboForex.com
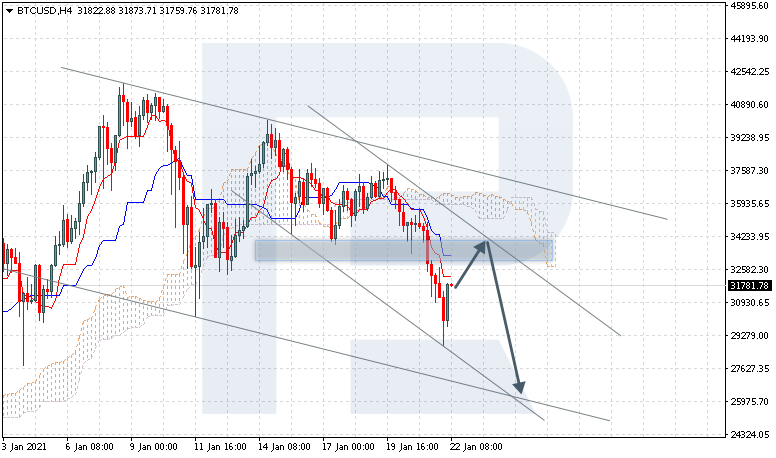
BTCUSD, “Bitcoin vs US Dollar”
BTCUSD is trading at 31781.00; the instrument is moving below Ichimoku Cloud, thus indicating a descending tendency. The markets could indicate that the price may test Tenkan-Sen and Kijun-Sen at 33805.00 and then resume moving downwards to reach 26355.00. Another signal in favor of a further downtrend will be a rebound from the descending channel’s upside border. However, the bearish scenario may no longer be valid if the price breaks the cloud’s upside border and fixes above 37590.00. In this case, the pair may continue growing towards 41105.00.

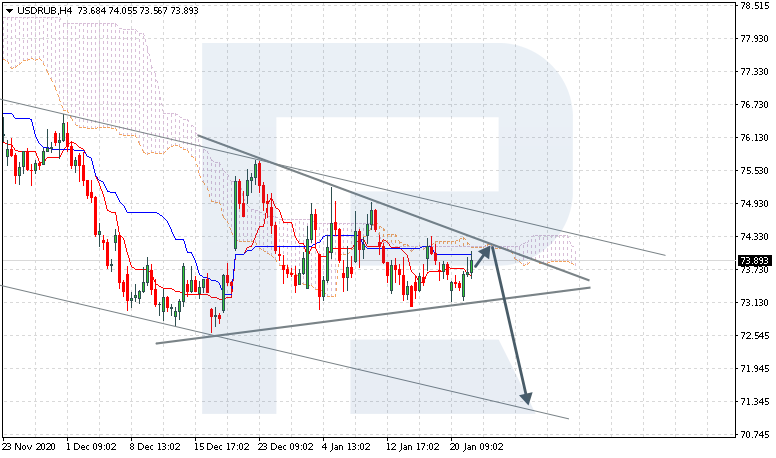
USDRUB, “US Dollar vs Russian Ruble”
USDRUB is trading at 73.89; the instrument is moving below Ichimoku Cloud, thus indicating a descending tendency. The markets could indicate that the price may test the cloud’s downside border at 73.95 and then resume moving downwards to reach 71.35. Another signal in favor of a further downtrend will be a rebound from the upside border of the Triangle pattern. However, the bearish scenario may be canceled if the price breaks the cloud’s upside border and fixes above 74.45. In this case, the pair may continue growing towards 75.55. To confirm further decline, the asset must break the pattern’s downside border and fix below 72.65.
Free Reports:
 Get our Weekly Commitment of Traders Reports - See where the biggest traders (Hedge Funds and Commercial Hedgers) are positioned in the futures markets on a weekly basis.
 Download Our Metatrader 4 Indicators – Put Our Free MetaTrader 4 Custom Indicators on your charts when you join our Weekly Newsletter
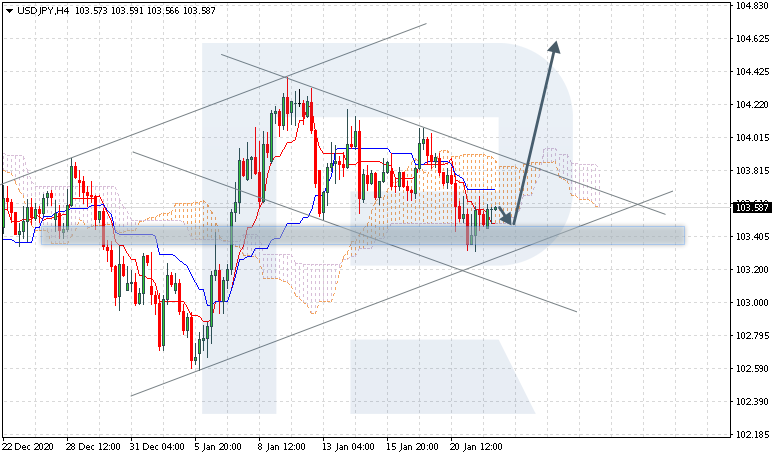
USDJPY, “US Dollar vs Japanese Yen”
USDJPY is trading at 103.58; the instrument is moving inside Ichimoku Cloud, thus indicating a sideways tendency. The markets could indicate that the price may test the cloud’s downside border at 103.55 and then resume moving upwards to reach 104.65. Another signal in favor of a further uptrend will be a rebound from the support level. However, the bullish scenario may no longer be valid if the price breaks the cloud’s downside border and fixes above 103.20. In this case, the pair may continue falling towards 102.35. To confirm further growth, the asset must break the descending channel’s upside border and fix above 103.95.
Article By RoboForex.com
Attention!
Forecasts presented in this section only reflect the author’s private opinion and should not be considered as guidance for trading. RoboForex LP bears no responsibility for trading results based on trading recommendations described in these analytical reviews.

- TSLA shares rose on a weak report. Inflationary pressures are easing in Australia Apr 24, 2024
- USDJPY: On intervention watch Apr 24, 2024
- Euro gains against the dollar amid mixed economic signals Apr 24, 2024
- PMI data is the focus of investors’ attention today. Turkey, Iraq, Qatar, and UAE signed a transportation agreement Apr 23, 2024
- Australian dollar rises on strong economic indicators Apr 23, 2024
- Geopolitical risks in the Middle East are declining. China kept interest rates at lows Apr 22, 2024
- Brent crude dips to four-week low amid easing geopolitical tensions Apr 22, 2024
- COT Metals Charts: Speculator bets led by Copper & Silver Apr 20, 2024
- COT Bonds Charts: Speculator bets led by 10-Year Bonds & Fed Funds Apr 20, 2024
- COT Stock Market Charts: Speculator bets led by S&P500-Mini Apr 20, 2024