
Article By RoboForex.com
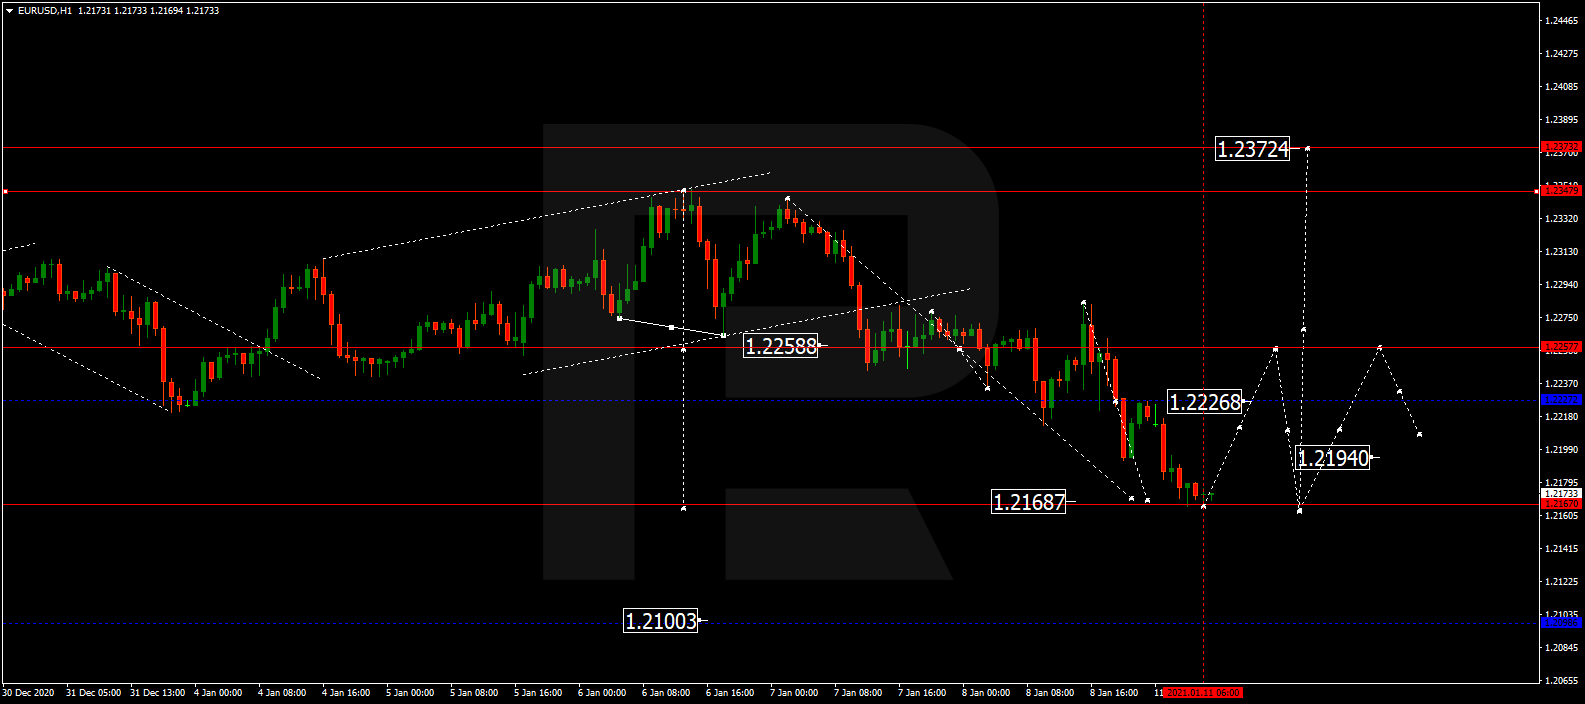
EURUSD, “Euro vs US Dollar”
After reaching the short-term downside target at 1.2170, EURUSD is expected to start another growth to test 1.2245 from below. After that, the instrument may resume trading downwards with the first target at 1.2160 and then start a new correction in the form of a Flag pattern to reach 1.2260.

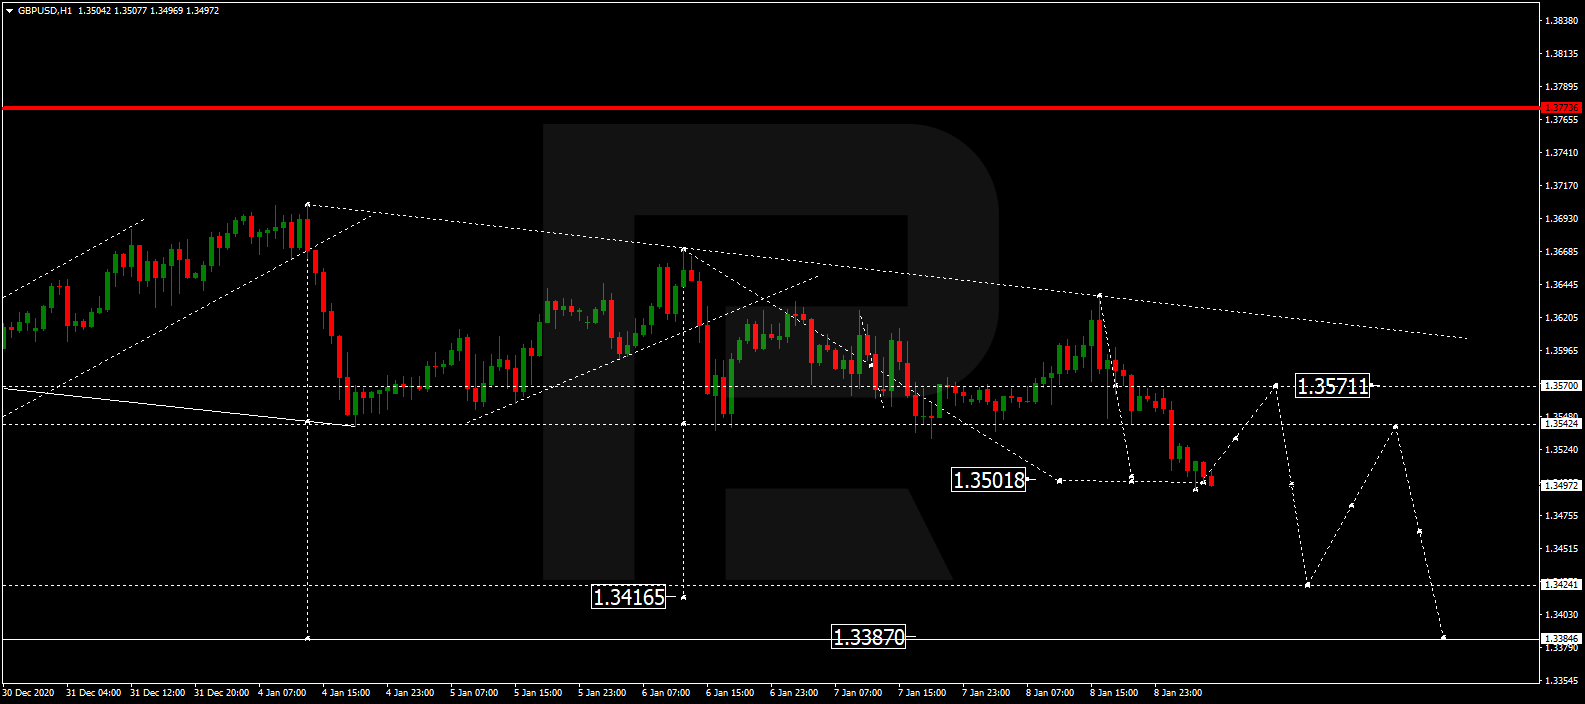
GBPUSD, “Great Britain Pound vs US Dollar”
After completing another descending wave at 1.3500, GBPUSD is expected to grow towards 1.3571. Later, the market may form a new descending structure with the first target at 1.3390.
Free Reports:
 Get our Weekly Commitment of Traders Reports - See where the biggest traders (Hedge Funds and Commercial Hedgers) are positioned in the futures markets on a weekly basis.
 Sign Up for Our Stock Market Newsletter – Get updated on News, Charts & Rankings of Public Companies when you join our Stocks Newsletter
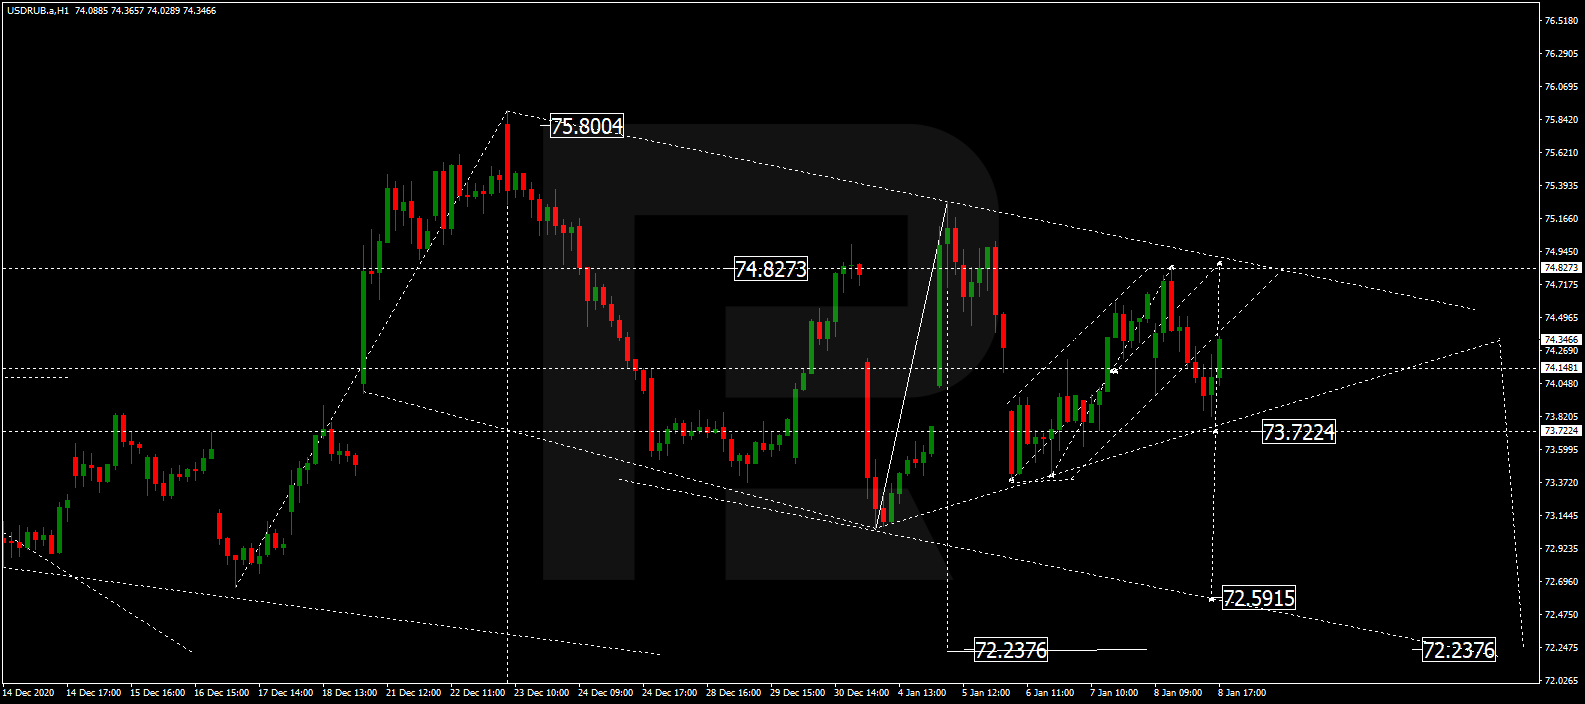
USDRUB, “US Dollar vs Russian Ruble”
USDRUB is consolidating around 74.14. Possibly, the pair may form one more ascending structure to reach 74.80 and then resume trading downwards to break 73.73. After that, the instrument may continue falling with the short-term target at 72.60.
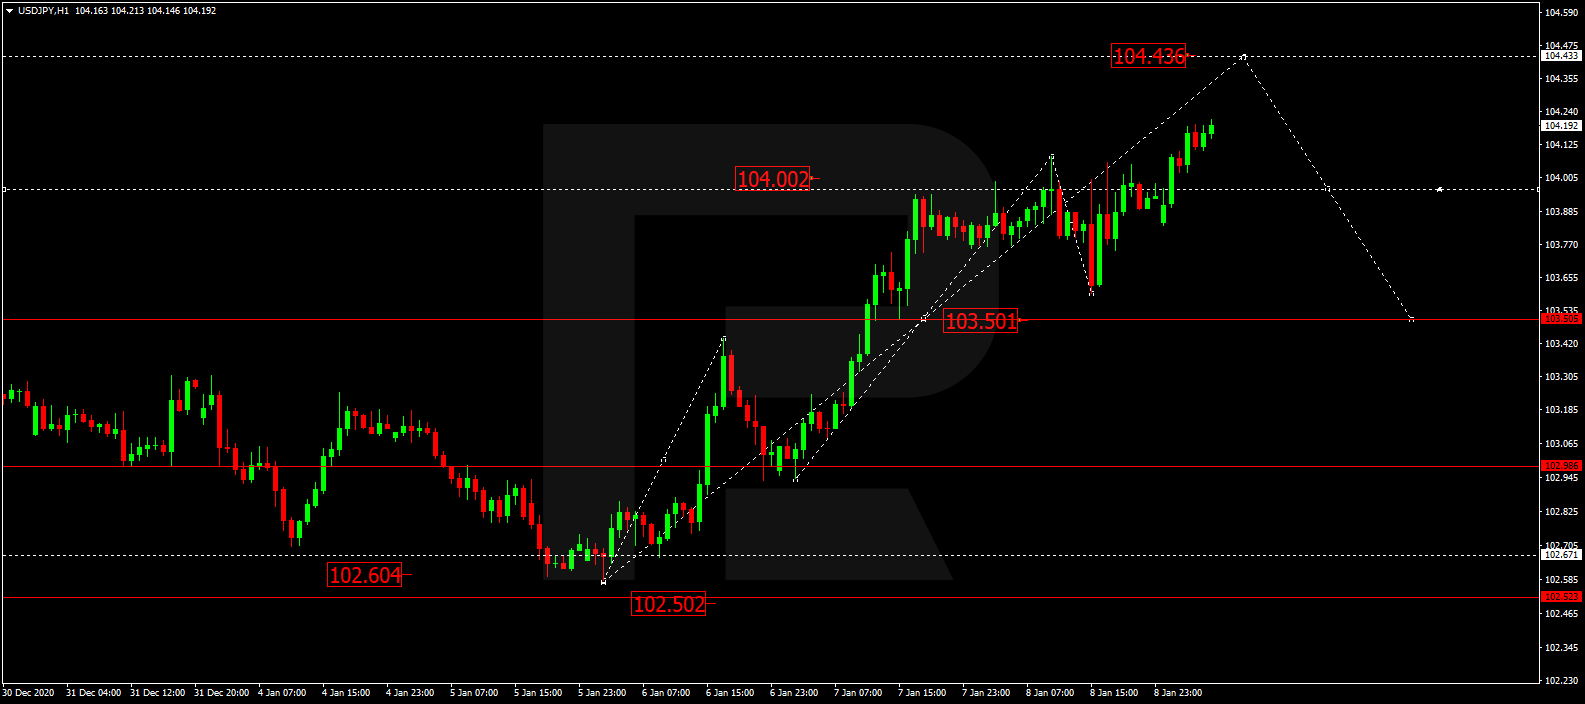
USDJPY, “US Dollar vs Japanese Yen”
After breaking 103.60 to the upside, USDJPY is expected to form one more ascending structure towards 104.44. Later, the market may start a new correction with the target at 103.50.
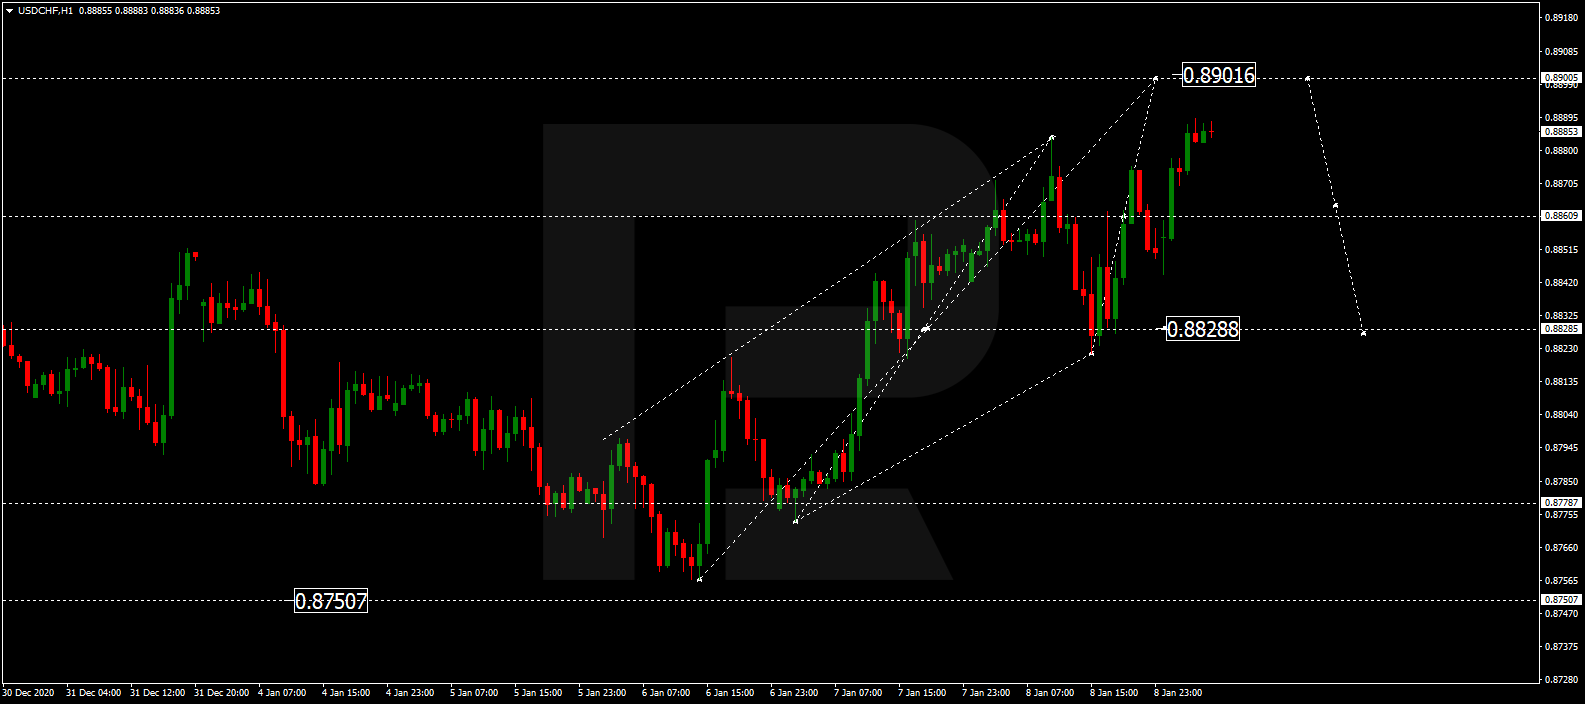
USDCHF, “US Dollar vs Swiss Franc”
After rebounding from 0.8828, USDCHF is growing towards 0.8900 and may later start another correction with the target at 0.8828.
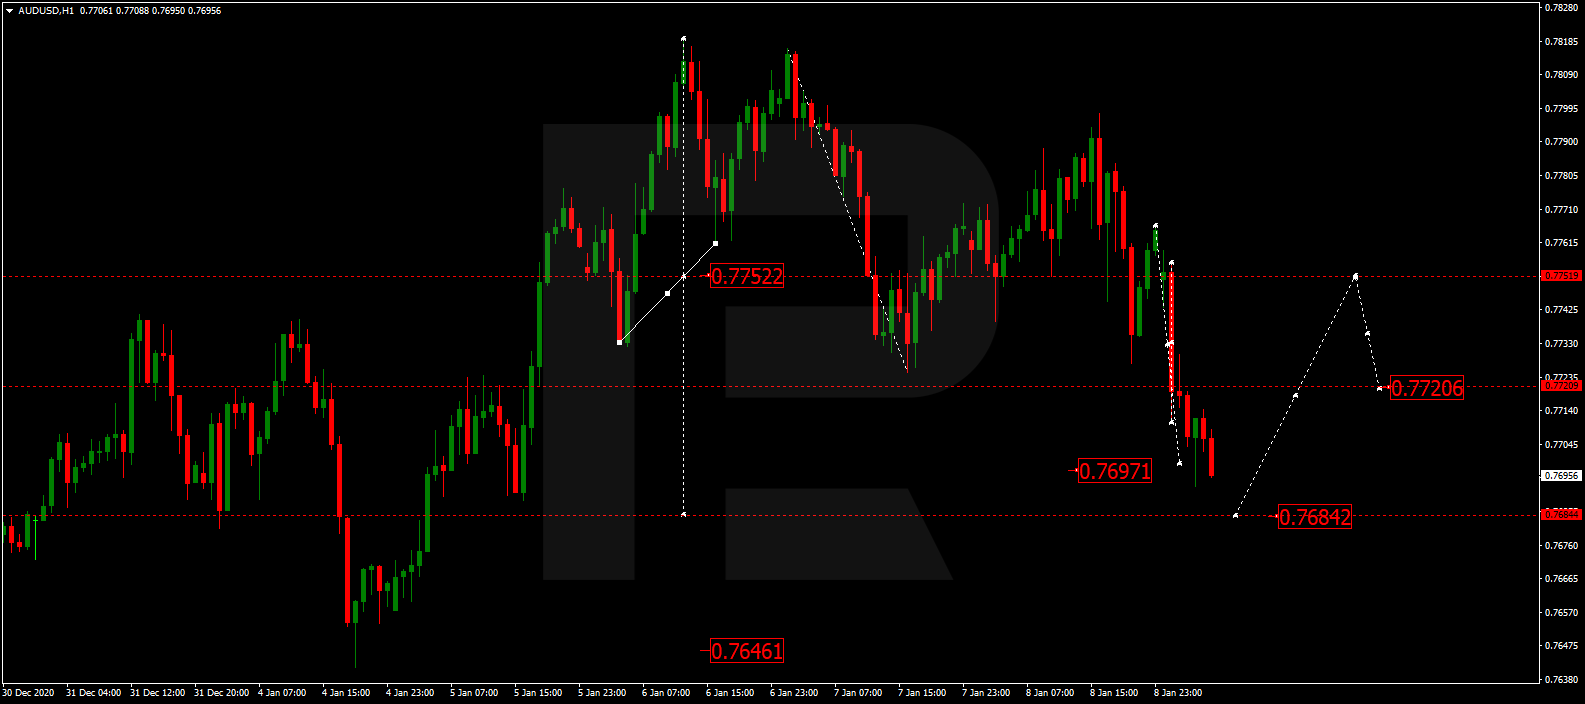
AUDUSD, “Australian Dollar vs US Dollar”
After breaking 0.7750 to the downside and then reaching 0.7700, AUDUSD is expected to form a new correctional structure to return to 0.7750 and test it from below. 0.7707. Later, the market may start another decline to complete this descending wave at 0.7680 and then resume growing with the target at 0.7766.
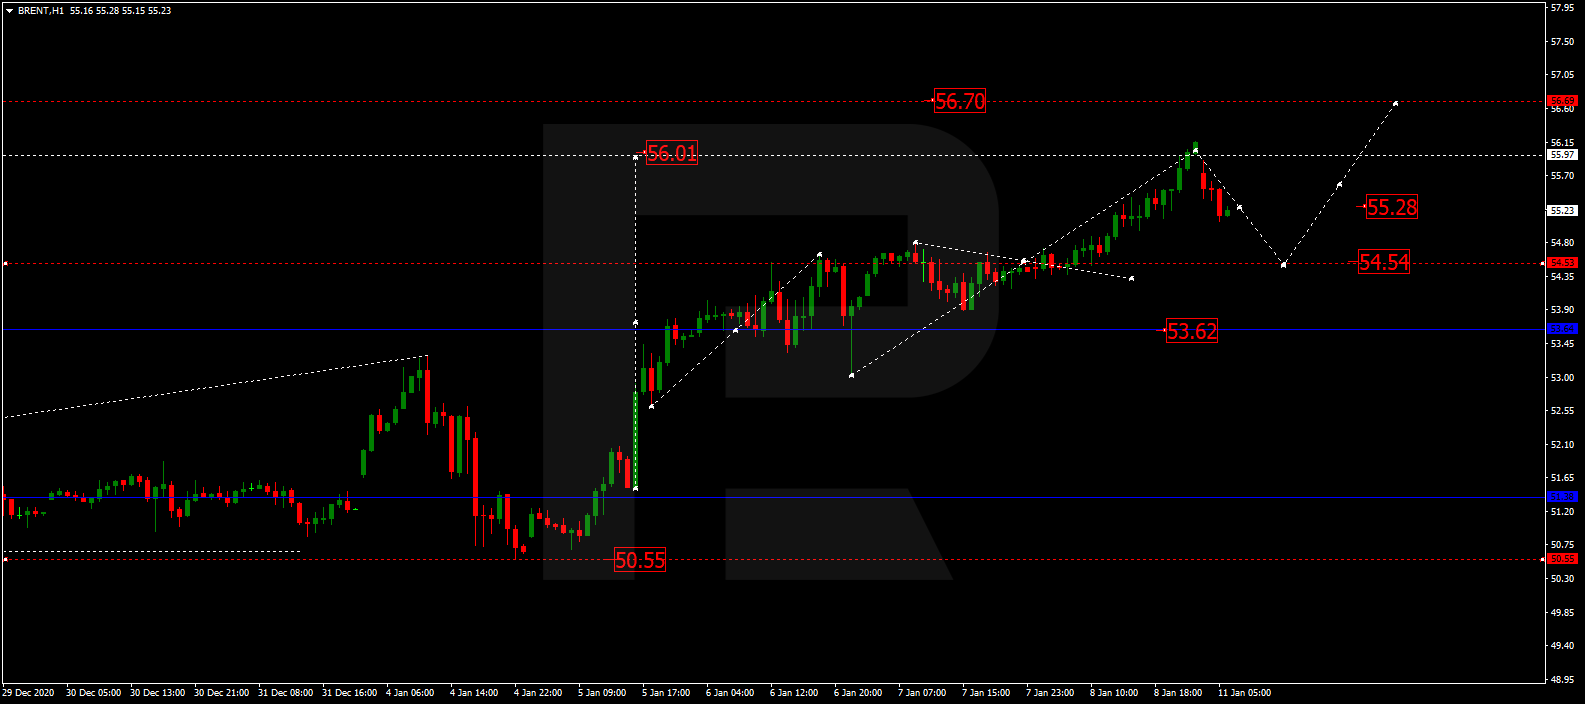
BRENT
After completing the ascending impulse at 56.00, Brent is consolidating below this level. If later the price breaks this range to the downside, the market may correct towards 54.54; if to the upside – expand the range up to 56.70 and then start a new correction with the target at 51.40.
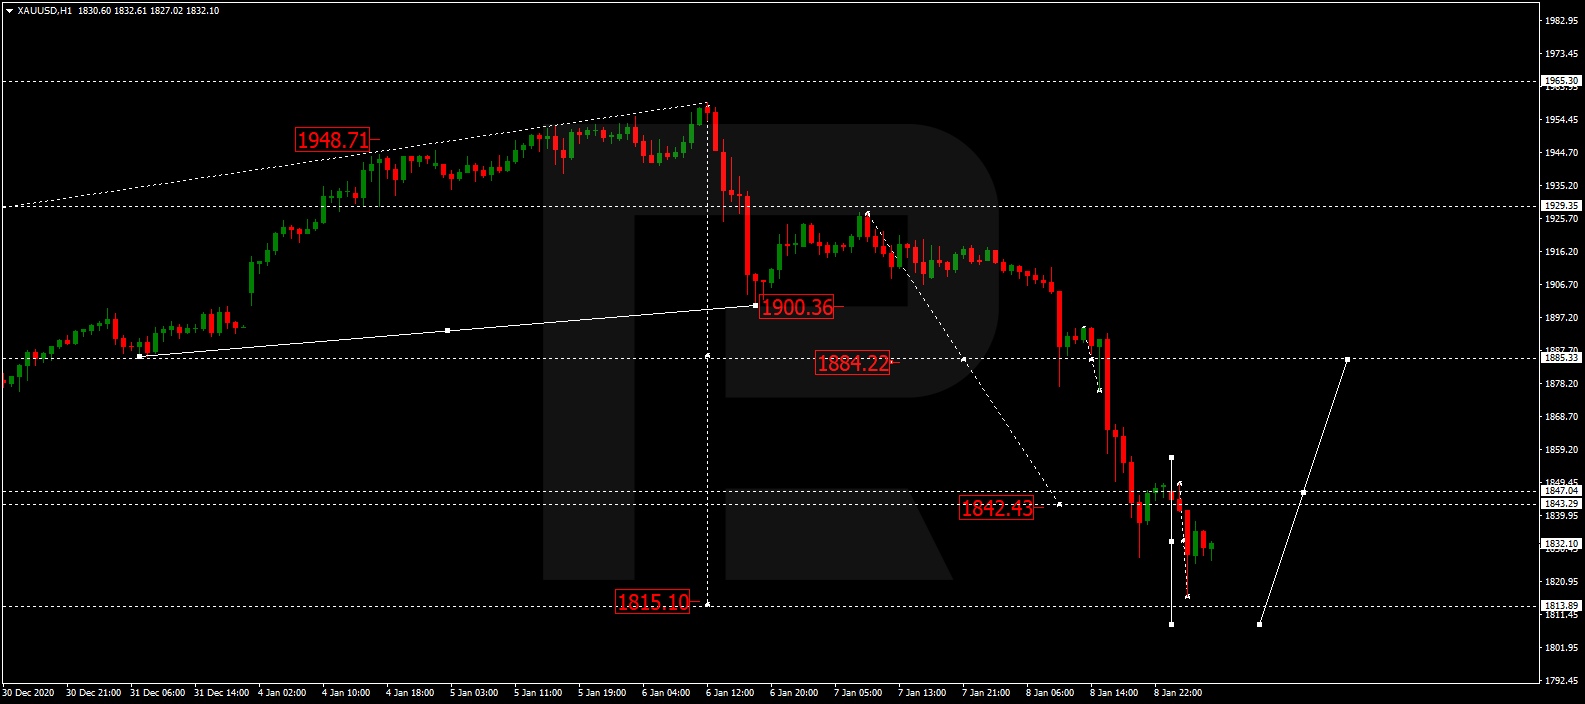
XAUUSD, “Gold vs US Dollar”
Gold has finished the descending wave at 1842.40. Possibly, today the metal may consolidate around this level. If later the price breaks this range to the downside, the market may form a new descending structure with the first target at 1815.10; if to the upside – start another growth to reach 1885.15 and then resume falling towards the above-mentioned target.
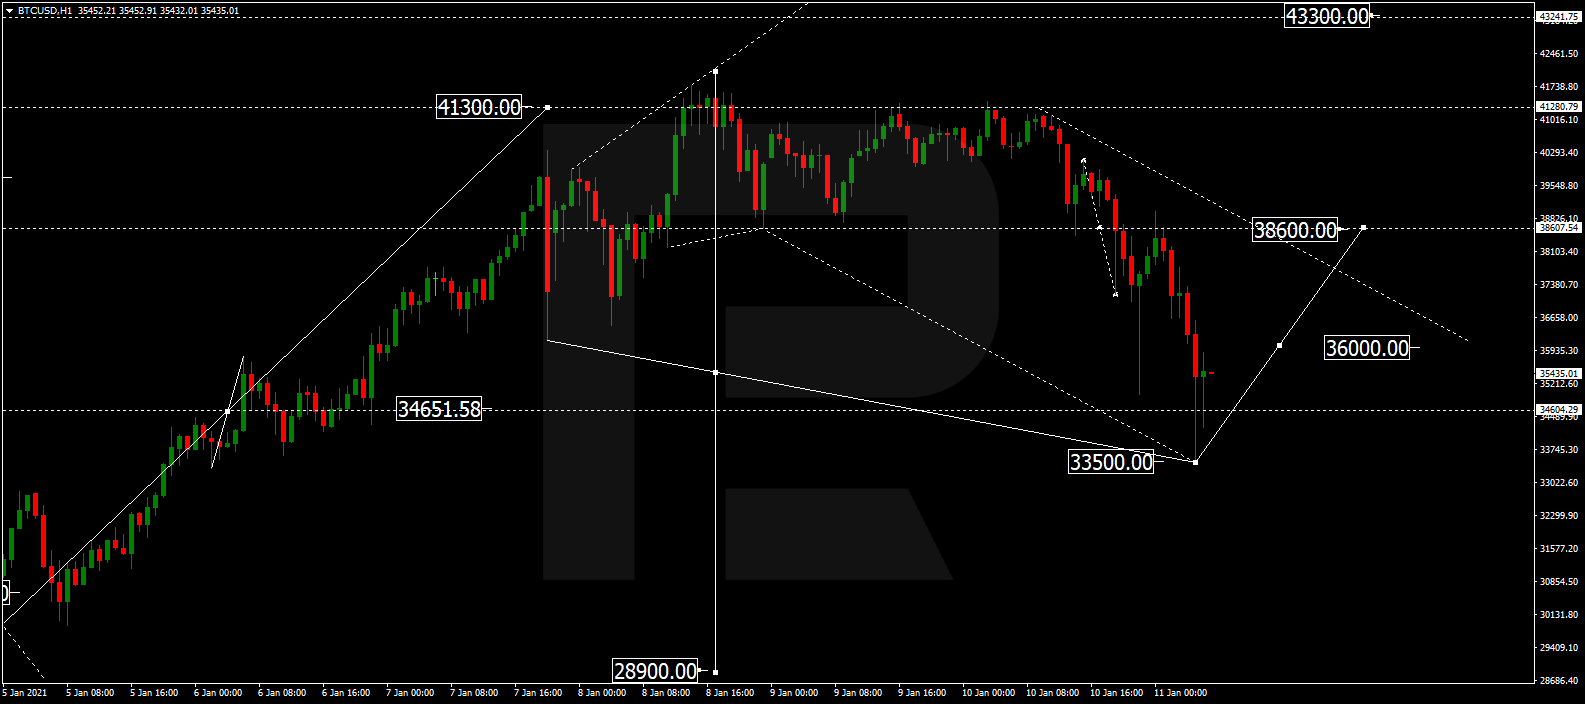
BTCUSD, “Bitcoin vs US Dollar”
After breaking 38600.00 and then reaching the first downside target at 33500.00, BTCUSD is expected to correct in the form of a Flag pattern to return to 38600.00. After that, the instrument may resume trading downwards with the target at 28900.00.
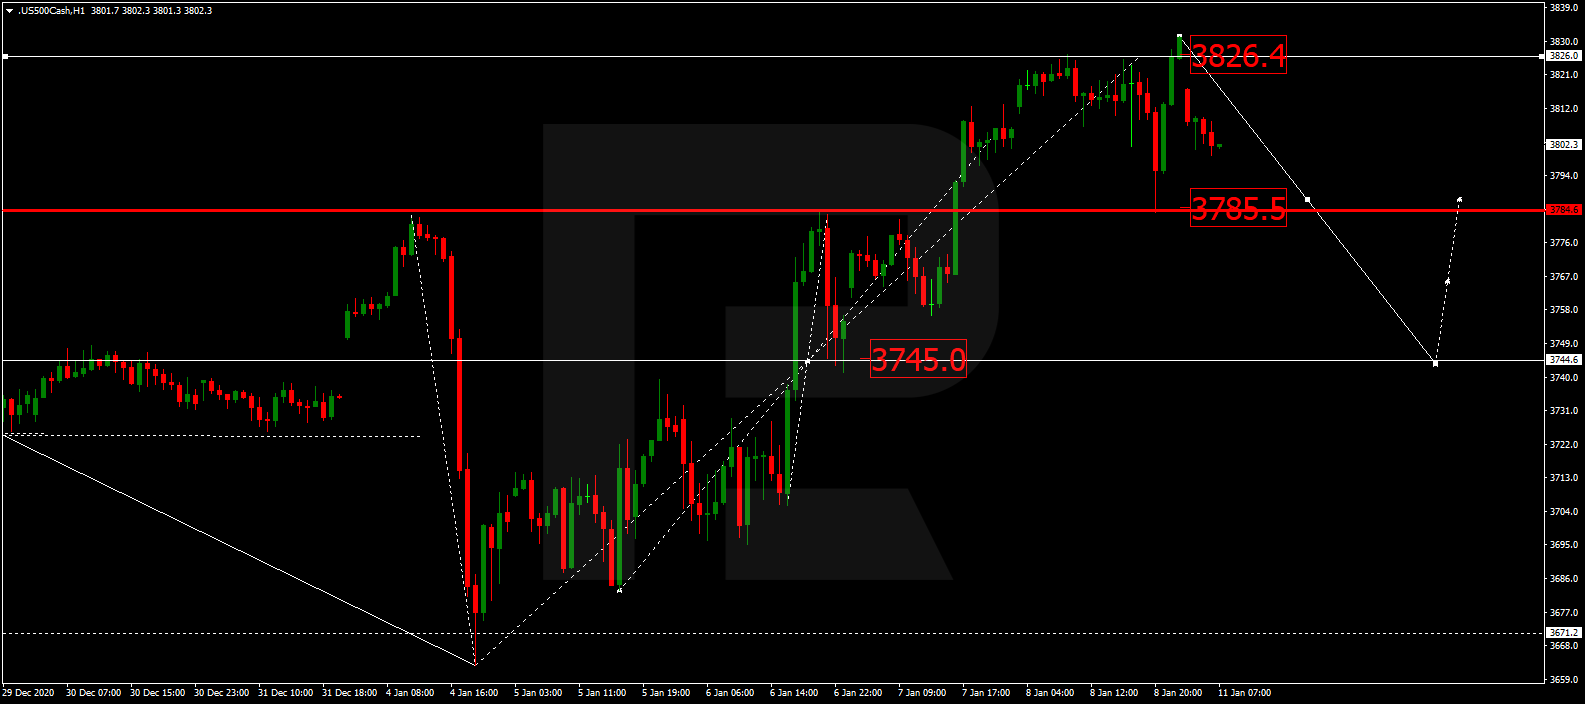
S&P 500
After finishing the ascending wave at 3826.4, the S&P index is falling to reach 3785.5. After that, the instrument may consolidate above the latter level. If later the price breaks this range to the downside, the market may resume moving downwards with the first target at 3745.0.
Article By RoboForex.com
Attention!
Forecasts presented in this section only reflect the author’s private opinion and should not be considered as guidance for trading. RoboForex LP bears no responsibility for trading results based on trading recommendations described in these analytical reviews.

- TSLA shares rose on a weak report. Inflationary pressures are easing in Australia Apr 24, 2024
- USDJPY: On intervention watch Apr 24, 2024
- Euro gains against the dollar amid mixed economic signals Apr 24, 2024
- PMI data is the focus of investors’ attention today. Turkey, Iraq, Qatar, and UAE signed a transportation agreement Apr 23, 2024
- Australian dollar rises on strong economic indicators Apr 23, 2024
- Geopolitical risks in the Middle East are declining. China kept interest rates at lows Apr 22, 2024
- Brent crude dips to four-week low amid easing geopolitical tensions Apr 22, 2024
- COT Metals Charts: Speculator bets led by Copper & Silver Apr 20, 2024
- COT Bonds Charts: Speculator bets led by 10-Year Bonds & Fed Funds Apr 20, 2024
- COT Stock Market Charts: Speculator bets led by S&P500-Mini Apr 20, 2024