
Article By RoboForex.com
BTCUSD, “Bitcoin vs US Dollar”
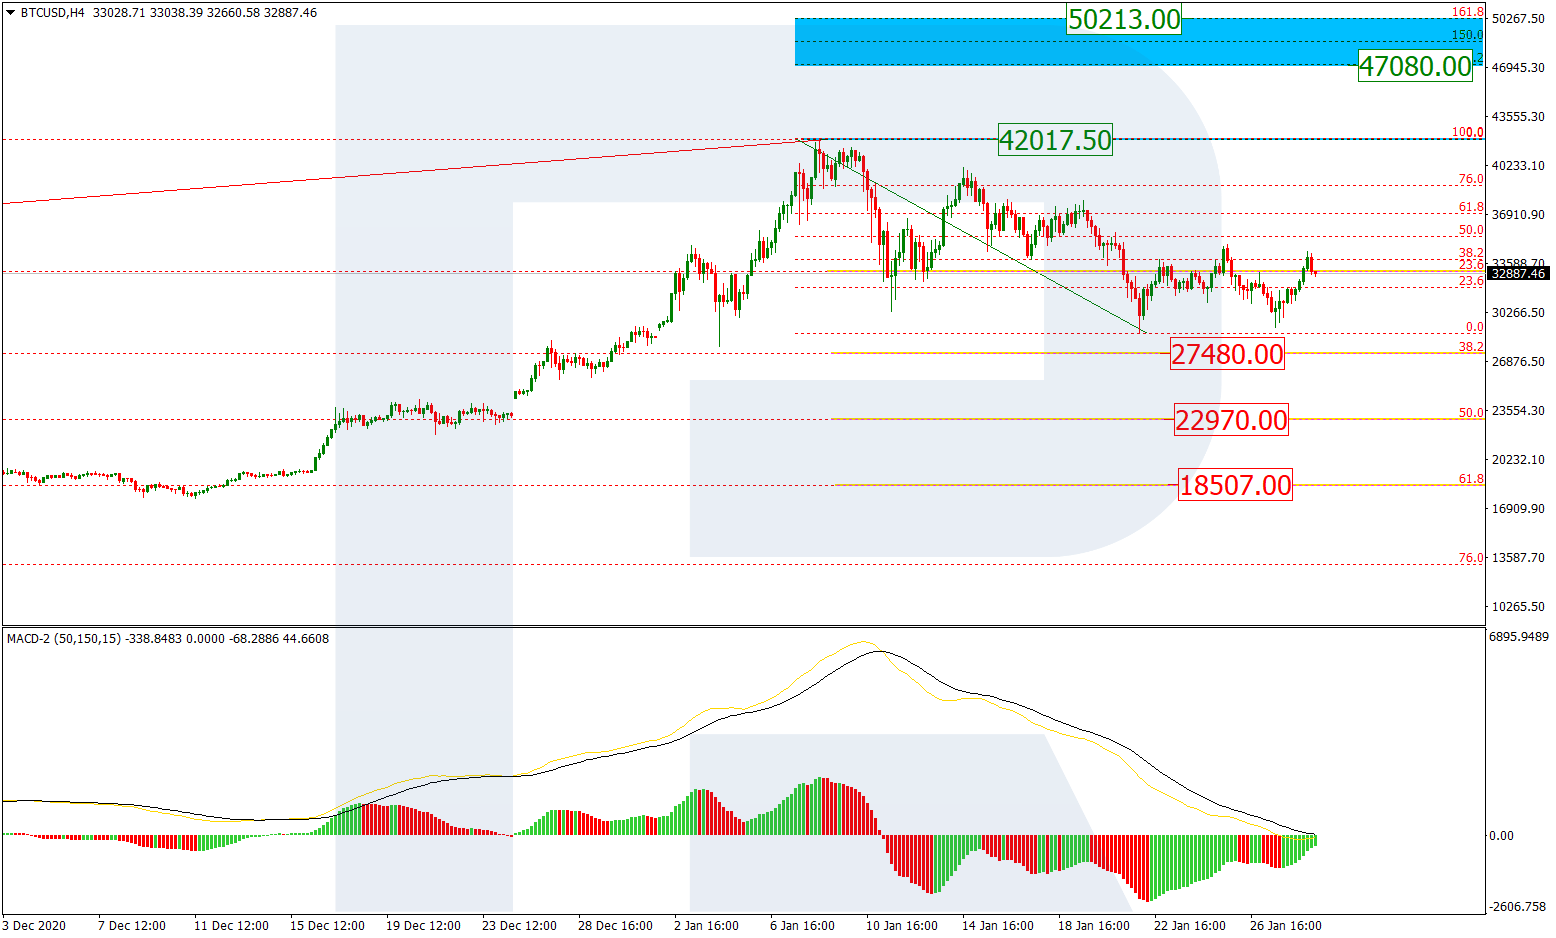
In the H4 chart, after several correctional waves to the downside, BTCUSD is trying to form a sideways channel. Later, the market may break this channel upwards to reach the high at 42017.50 and then continue growing towards the post-correctional extension area between 138.2% and 161.8% fibo at 47080.00 and 50213.00 respectively However, an alternative scenario suggests that the channel may be broken downwards. In this case, the asset may try to reach 38.2%, 50.0%, and 61.8% fibo at 27480.00, 22970.00, and 18507.00 respectively again.

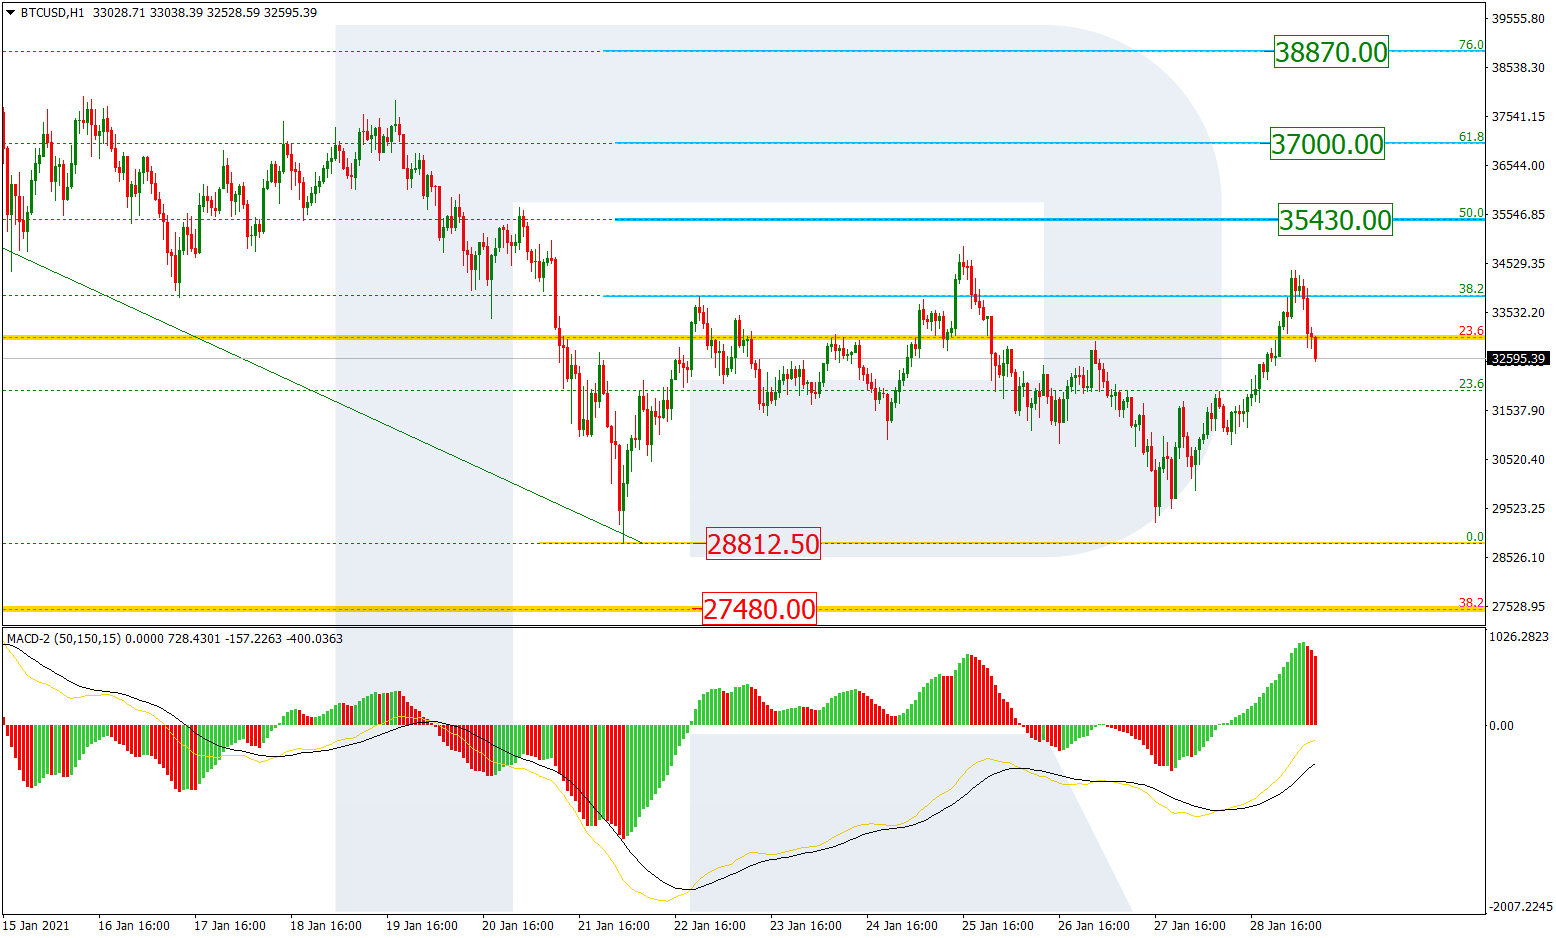
The H1 chart shows a new rising wave and the price is re-testing 38.2% fibo. If the price reaches 50.0%, 61.8%, and 76.0% fibo at 35430.00, 37000.00, and 38870.00 respectively, it will be a signal to confirm further growth. On the other hand, a breakout of the low at 28812.50 may hint at a further mid-term correction to the downside.
Free Reports:
 Download Our Metatrader 4 Indicators – Put Our Free MetaTrader 4 Custom Indicators on your charts when you join our Weekly Newsletter
 Get our Weekly Commitment of Traders Reports - See where the biggest traders (Hedge Funds and Commercial Hedgers) are positioned in the futures markets on a weekly basis.
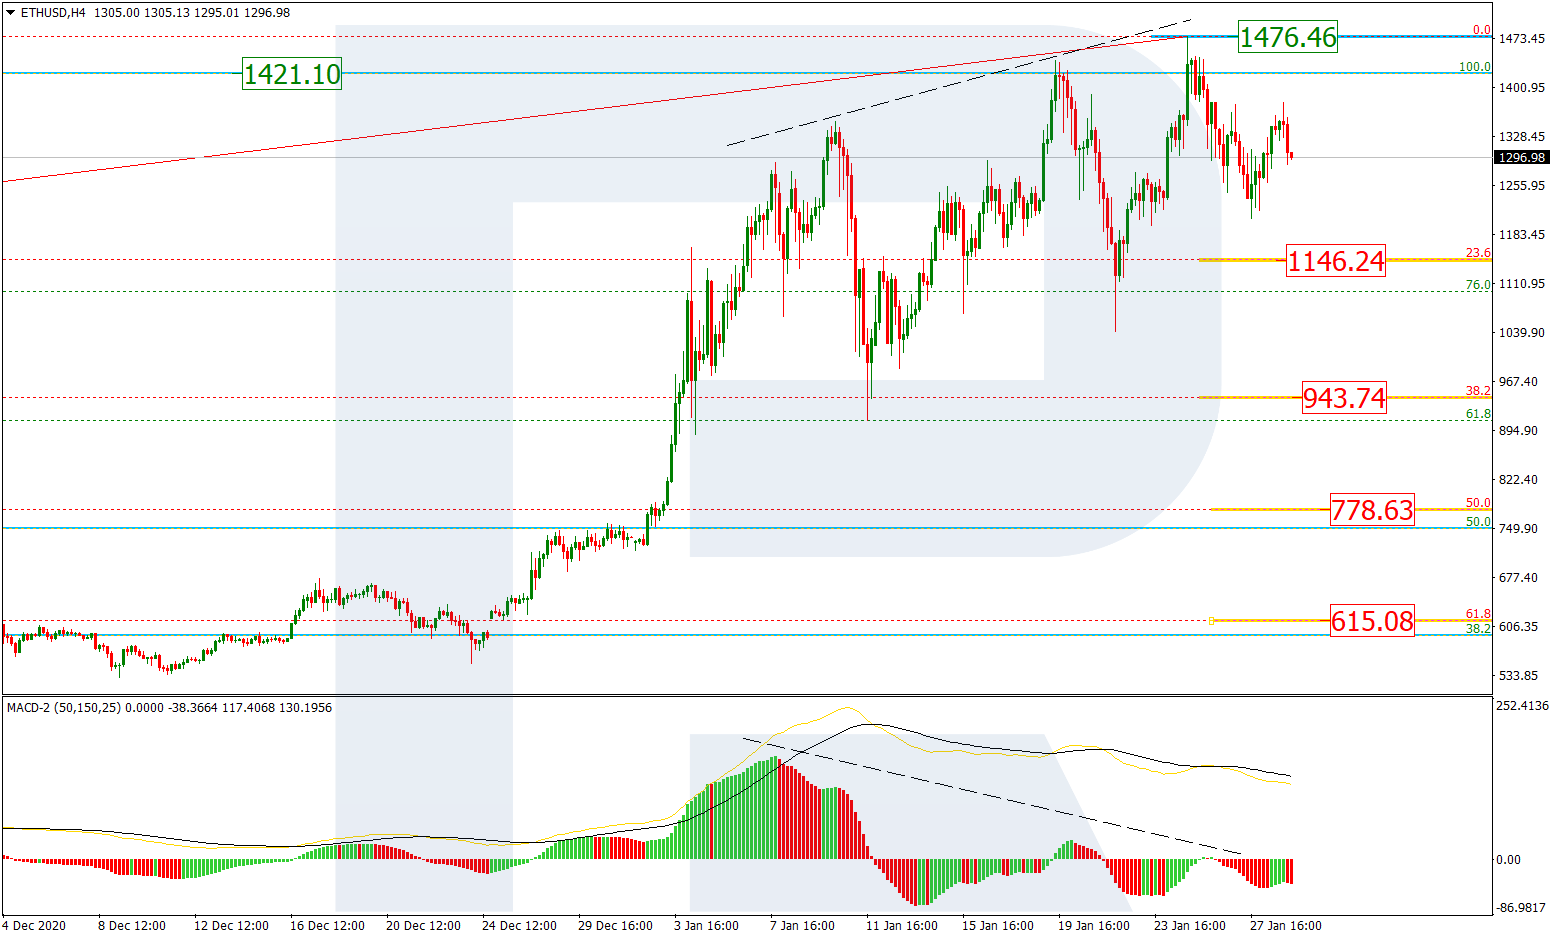
The H4 chart shows a new correctional wave to the downside after a divergence on MACD, which is heading towards 23.6% fibo at 1146.24. Later, ETHUSD may continue falling to reach 38.2%, 50.0%, and 61.8% fibo at 943.74, 778.63, and 615.08 respectively. The resistance is the new all-time high at 1476.46.
4-часовой таймфрейм Эфириума (Ethereum) демонстрирует развитие новой волны коррекционного спада после обновления последнего максимума и дивергенции. Снижение нацелено на уровень 23,6% по Фибоначчи (1146,24). Дальнейшее снижение может быть направлено к уровням 38,2% (943,74), 50,0% (7778,63) и 61,8% (615,08). Сопротивлением служит новый исторический максимум – 1476,46.
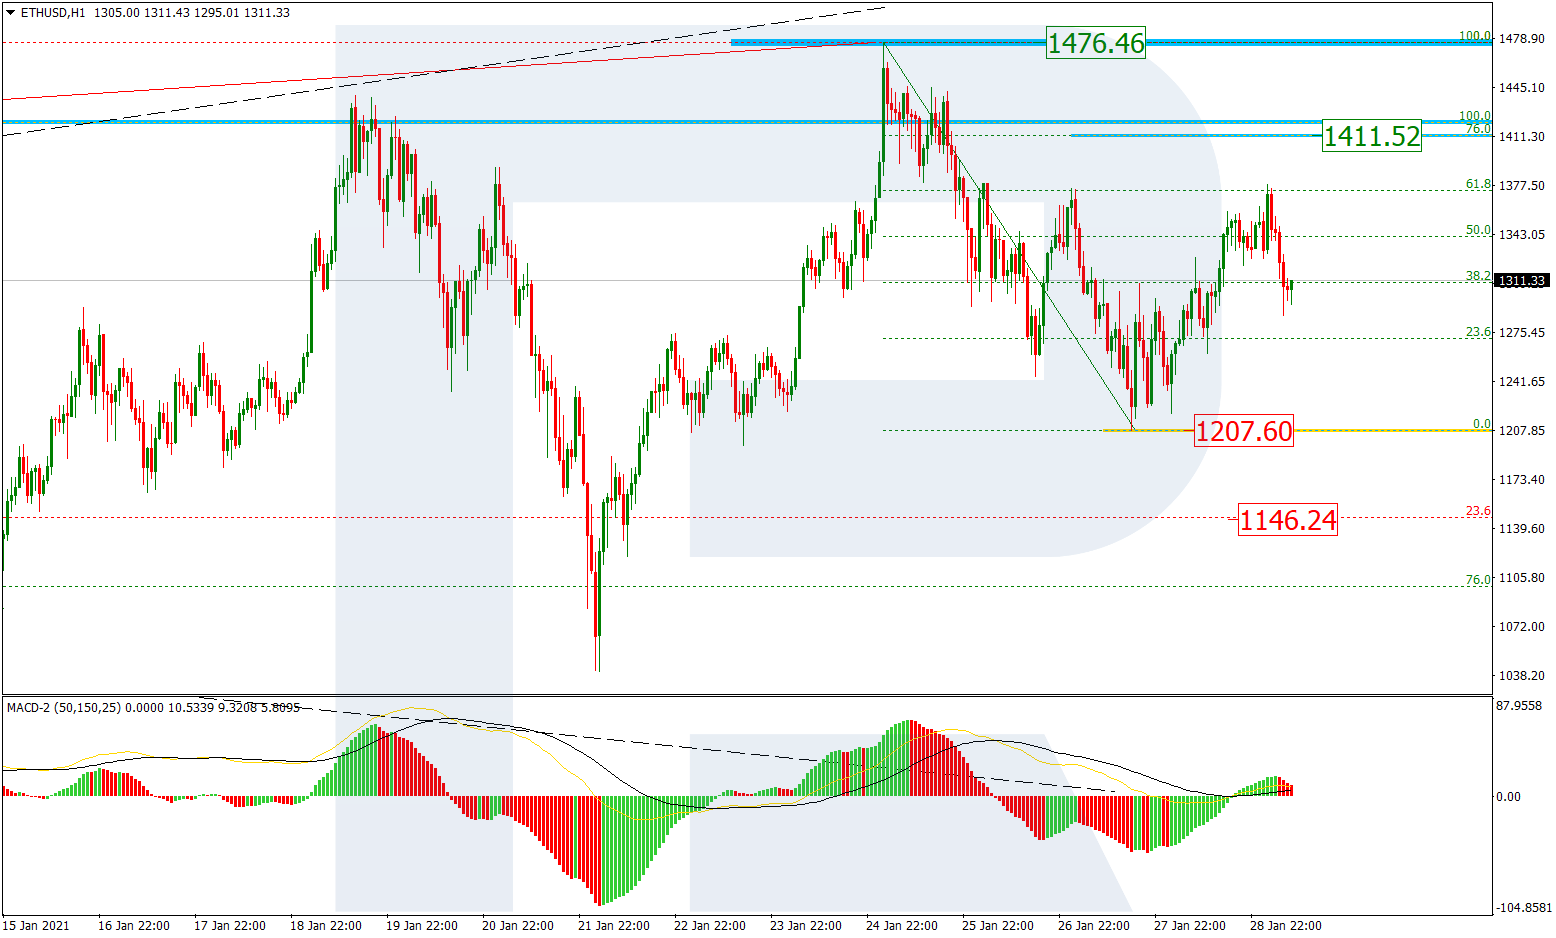
As we can see in the H1 chart, the pair is correcting after completing the descending wave and has already reached 61.8% fibo. Later, the price may continue growing towards 76.0% fibo at 1411.52. The correction may transform into a proper rising wave and update the high. A breakout of the local low at 1207.60 may hint at a further mid-term downtrend.
Article By RoboForex.com
Attention!
Forecasts presented in this section only reflect the author’s private opinion and should not be considered as guidance for trading. RoboForex LP bears no responsibility for trading results based on trading recommendations described in these analytical reviews.

- Target Thursdays: NAS100, Robusta Coffee, USDCHF Apr 25, 2024
- QCOM wants to create competition in the AI chip market. Hong Kong index hits five-month high Apr 25, 2024
- Japanese yen hits all-time low as BoJ meeting commences Apr 25, 2024
- TSLA shares rose on a weak report. Inflationary pressures are easing in Australia Apr 24, 2024
- USDJPY: On intervention watch Apr 24, 2024
- Euro gains against the dollar amid mixed economic signals Apr 24, 2024
- PMI data is the focus of investors’ attention today. Turkey, Iraq, Qatar, and UAE signed a transportation agreement Apr 23, 2024
- Australian dollar rises on strong economic indicators Apr 23, 2024
- Geopolitical risks in the Middle East are declining. China kept interest rates at lows Apr 22, 2024
- Brent crude dips to four-week low amid easing geopolitical tensions Apr 22, 2024