
Article By RoboForex.com
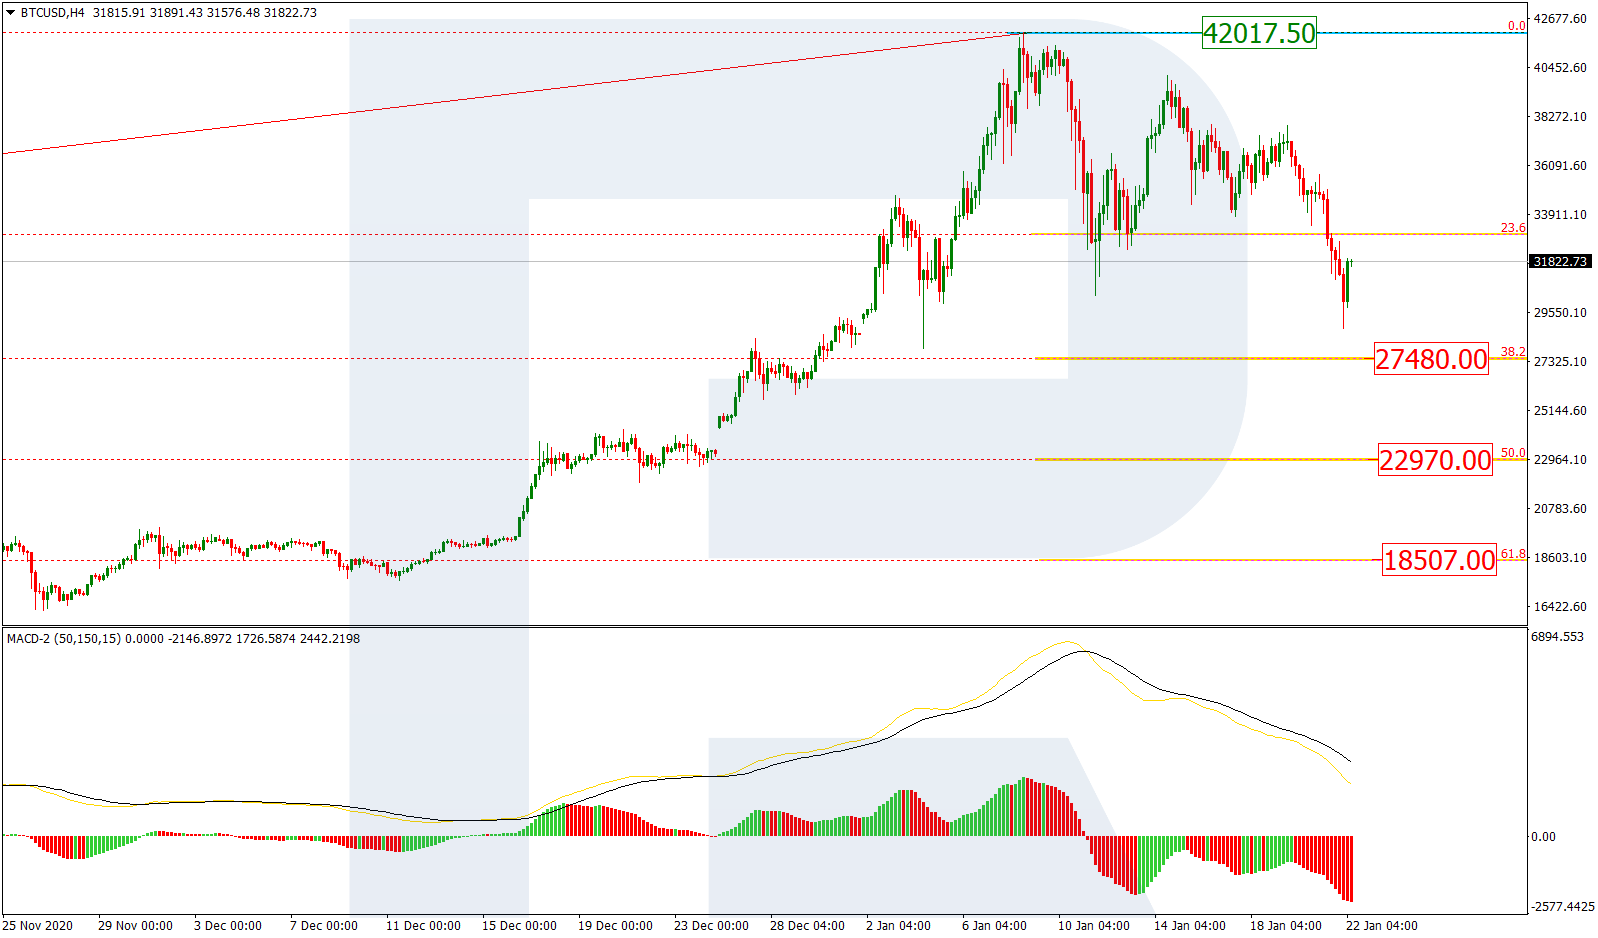
BTCUSD, “Bitcoin vs US Dollar”
In the H4 chart, BTCUSD is forming another descending correctional wave. Earlier, the first wave reached 23.6% and was followed by a pullback to the upside. The current decline has already updated the local low and may reach 38.2% at 27480.00. if the price breaks this level, the asset may continue falling towards 50.0% and 61.8% fibo at 22970.00 and 18507.00 respectively. After completing the correction, the asset may resume growing and break the high at 42017.50.

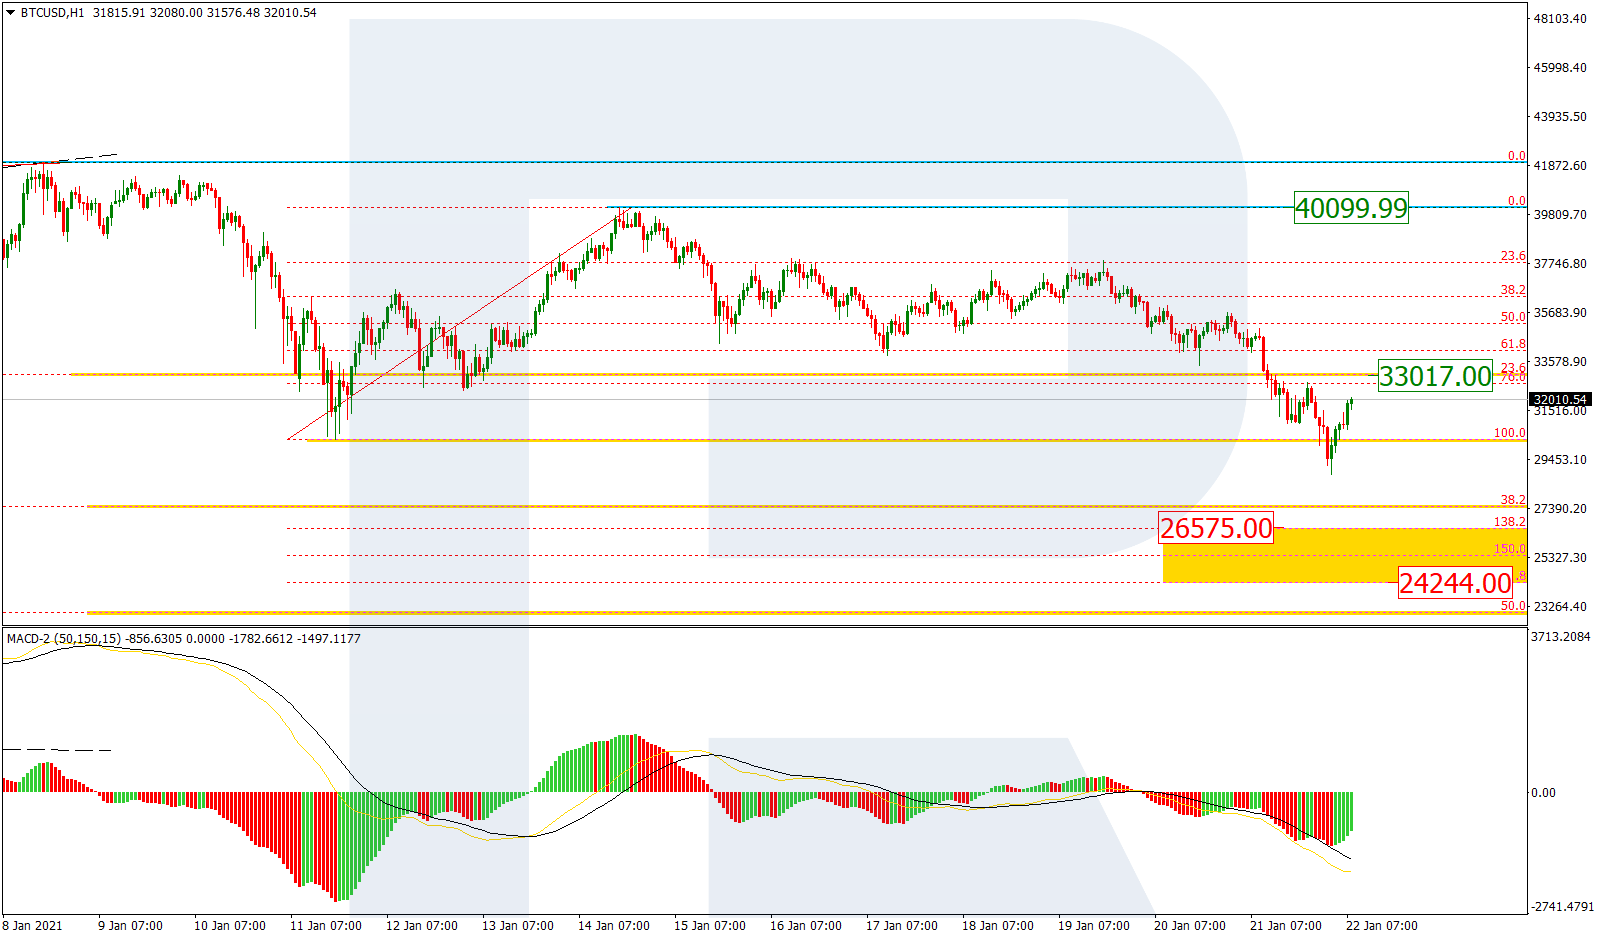
The H1 chart shows a short-term correctional uptrend after a breakout of the local low, which is heading towards the local resistance at 33017.00. The key resistance is at 40099.99, a breakout of which may complete the correction. After that, the instrument may start a new decline to reach the post-correctional extension area between 138.2% and 161.8% fibo at 26575.00 and 24244.00 respectively.
Free Reports:
 Get our Weekly Commitment of Traders Reports - See where the biggest traders (Hedge Funds and Commercial Hedgers) are positioned in the futures markets on a weekly basis.
 Sign Up for Our Stock Market Newsletter – Get updated on News, Charts & Rankings of Public Companies when you join our Stocks Newsletter
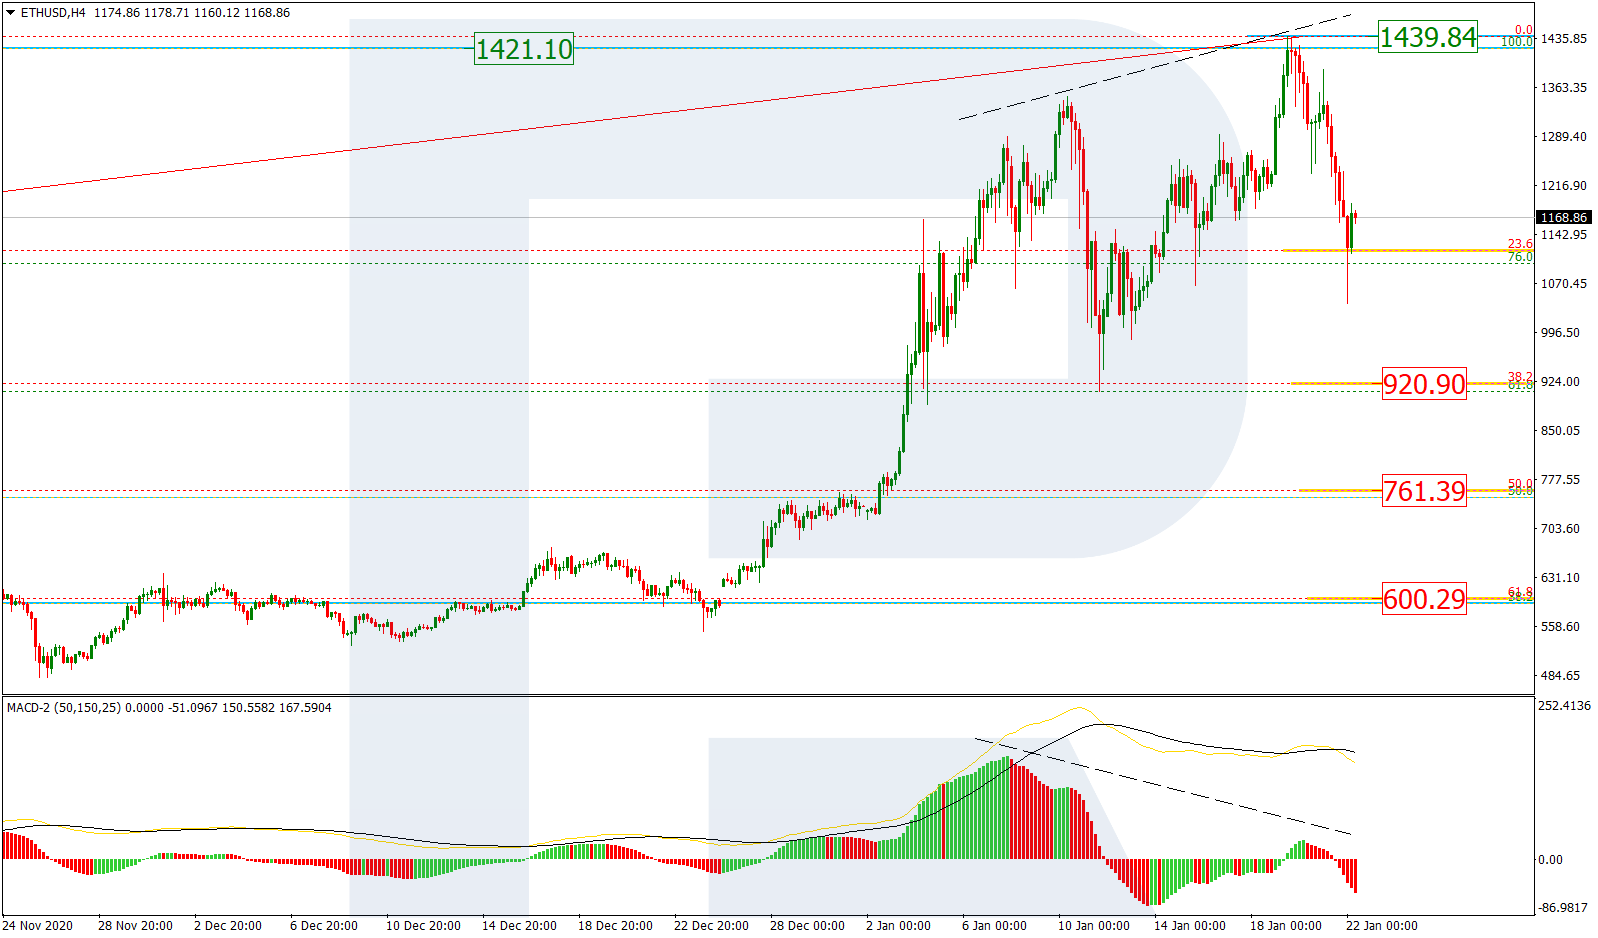
ETHUSD, “Ethereum vs. US Dollar”
The H4 chart shows the first descending correctional wave after a divergence on MACD, which has already reached 23.6% fibo; right now, the asset is starting a new pullback. Later, after finishing the pullback, ETHUSD may resume falling to reach 38.2%, 50.0%, and 61.8% fibo at 920.90, 761.39, and 600.29 respectively. The resistance is the new all-time high at 1439.84.
As we can see in the H1 chart, the pair is correcting after completing the descending wave and has already reached 38.2% fibo. Later, the price may continue growing towards 50.0% and 61.8% fibo at 1215.41 and 1255.87 respectively. A breakout of the local low may hint at a further mid-term downtrend.

Article By RoboForex.com
Attention!
Forecasts presented in this section only reflect the author’s private opinion and should not be considered as guidance for trading. RoboForex LP bears no responsibility for trading results based on trading recommendations described in these analytical reviews.

- Target Thursdays: NAS100, Robusta Coffee, USDCHF Apr 25, 2024
- QCOM wants to create competition in the AI chip market. Hong Kong index hits five-month high Apr 25, 2024
- Japanese yen hits all-time low as BoJ meeting commences Apr 25, 2024
- TSLA shares rose on a weak report. Inflationary pressures are easing in Australia Apr 24, 2024
- USDJPY: On intervention watch Apr 24, 2024
- Euro gains against the dollar amid mixed economic signals Apr 24, 2024
- PMI data is the focus of investors’ attention today. Turkey, Iraq, Qatar, and UAE signed a transportation agreement Apr 23, 2024
- Australian dollar rises on strong economic indicators Apr 23, 2024
- Geopolitical risks in the Middle East are declining. China kept interest rates at lows Apr 22, 2024
- Brent crude dips to four-week low amid easing geopolitical tensions Apr 22, 2024