
Article By RoboForex.com
GBPUSD, “Great Britain Pound vs US Dollar”
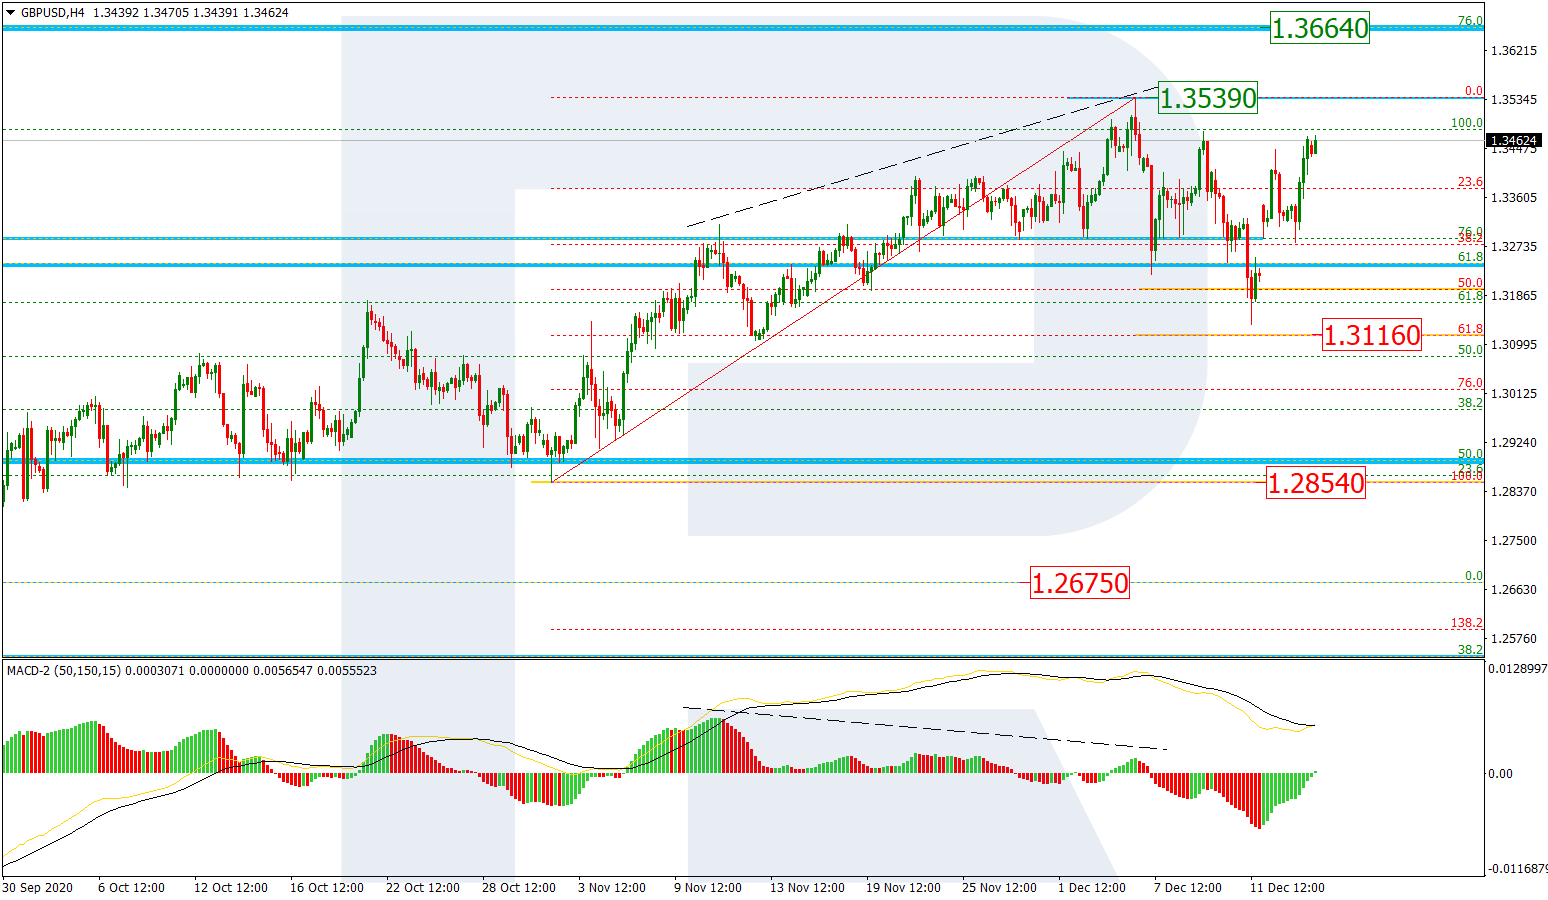
In the H4 chart, after completing the correction at 61.8% fibo (1.3116), GBPUSD is forming another rising impulse towards the high at 1.3539. If the price breaks the high, it may continue trading upwards to reach the long-term 76.0% fibo at 1.3664 and the post-correctional extension area between 138.2% and 161.8% fibo at 1.3792 and 1.3980 respectively. The local support is at 1.2854.

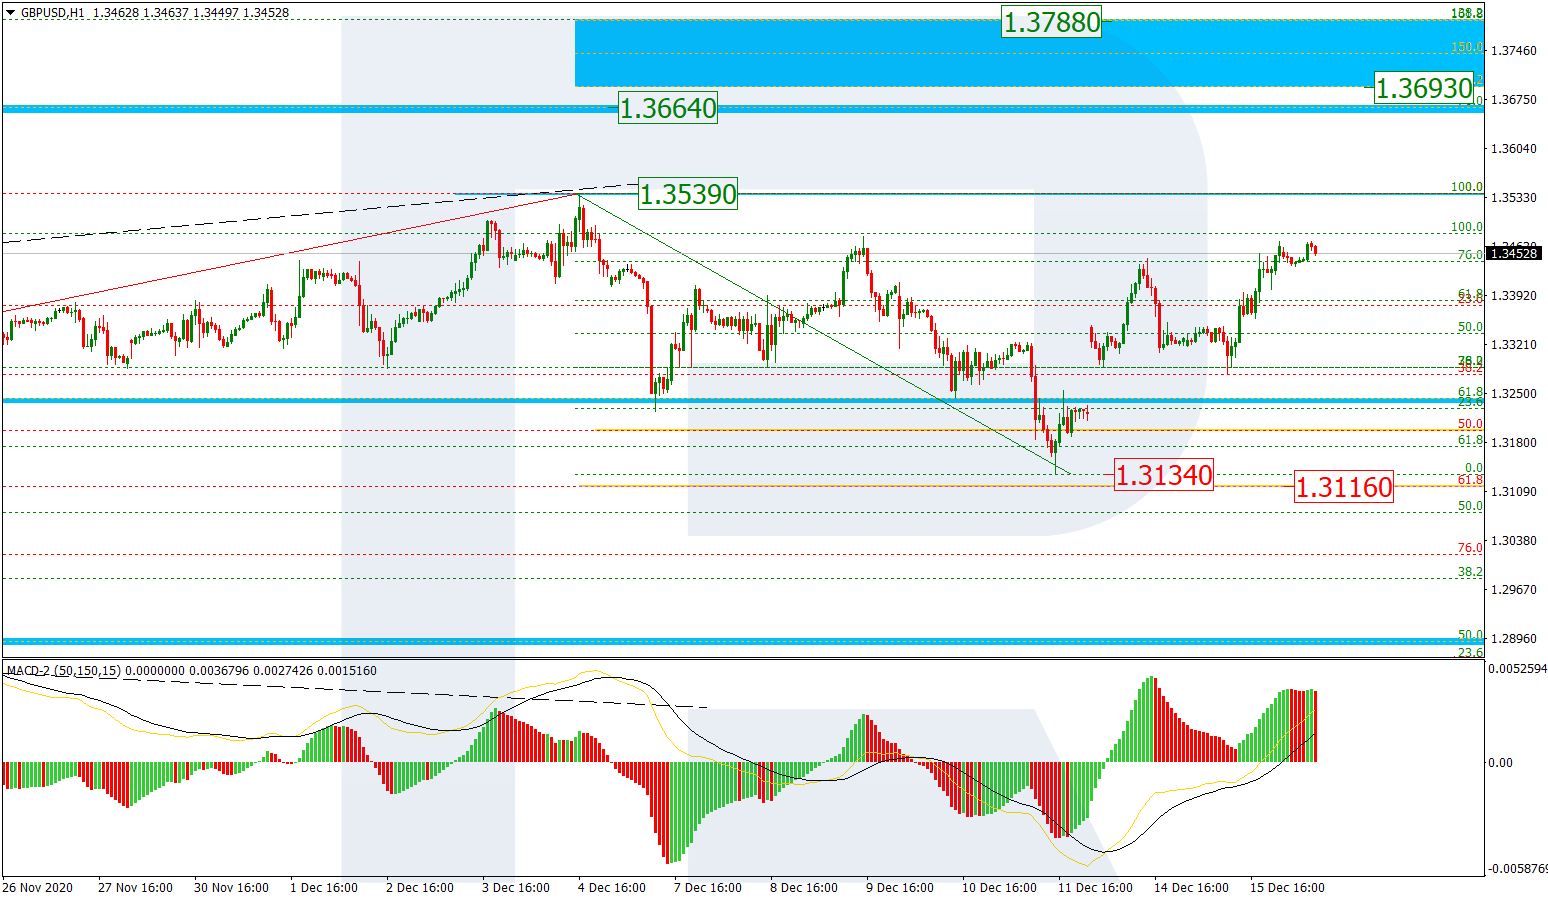
The H1 chart shows a more detailed structure of the current ascending wave, which has already reached 76.0% fibo and may later continue towards the local post-correctional extension area between 138.2% and 161.8% fibo at 1.3639 and 1.3788 respectively. the short-term support is the fractal low at 1.3134.
Free Reports:
 Download Our Metatrader 4 Indicators – Put Our Free MetaTrader 4 Custom Indicators on your charts when you join our Weekly Newsletter
 Get our Weekly Commitment of Traders Reports - See where the biggest traders (Hedge Funds and Commercial Hedgers) are positioned in the futures markets on a weekly basis.
EURJPY, “Euro vs. Japanese Yen”
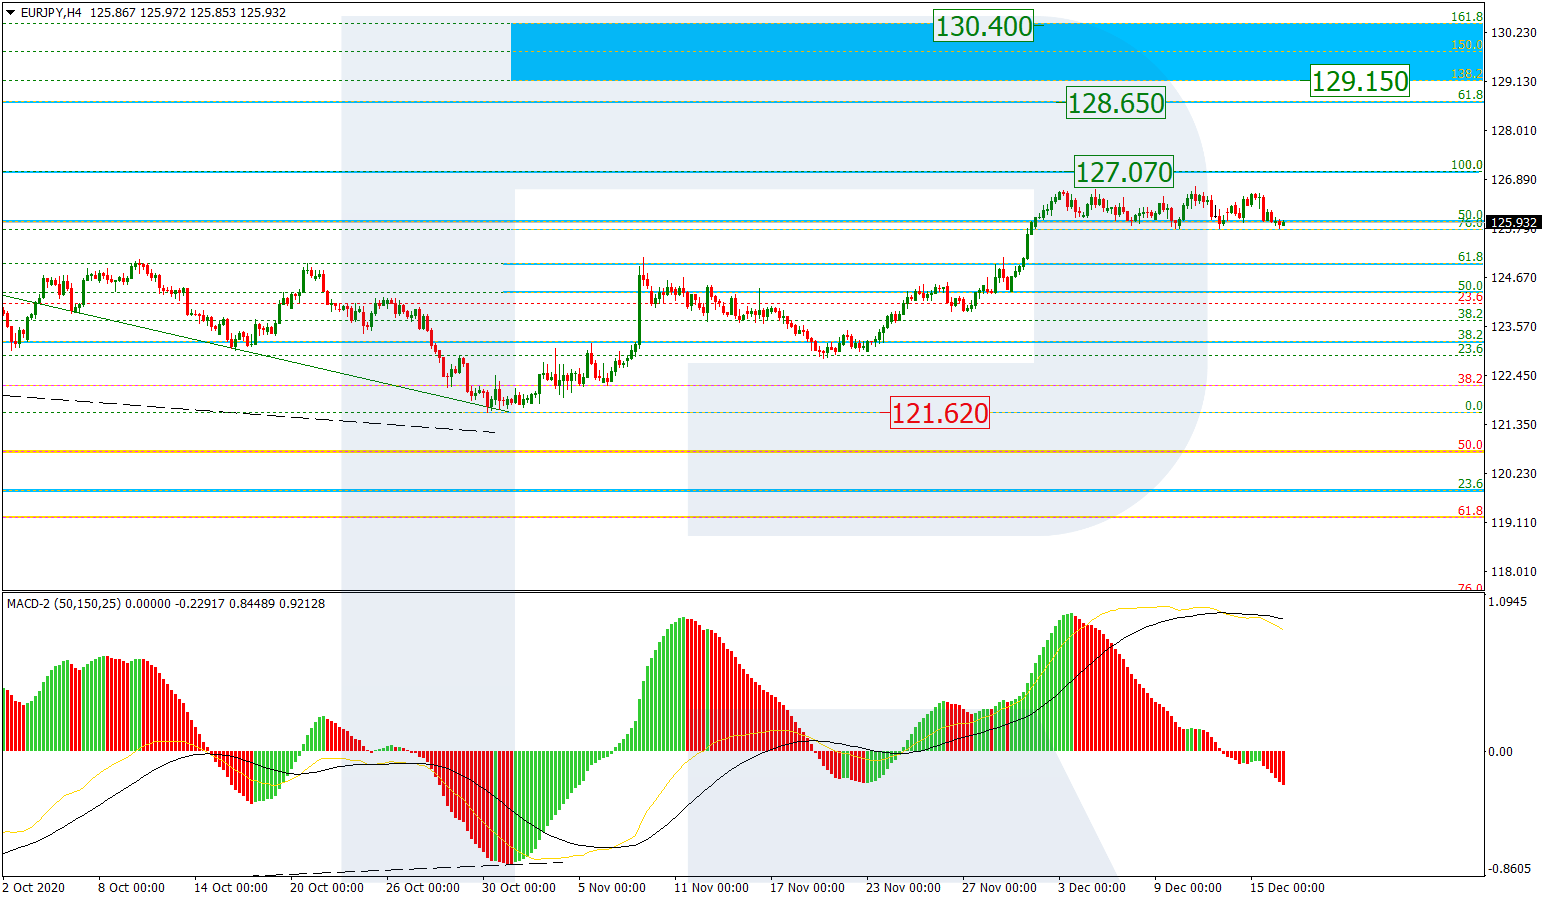
In the H4 chart, the situation hasn’t changed much. EURJPY has stopped growing not far from the high at 127.07. After breaking the high, the asset may continue growing towards the mid-term 61.8% fibo at 128.65 and then the post-correctional extension area between 138.2% and 161.8% fibo at 129.15 and 130.40 respectively. The key support remains at the fractal low at 121.62.
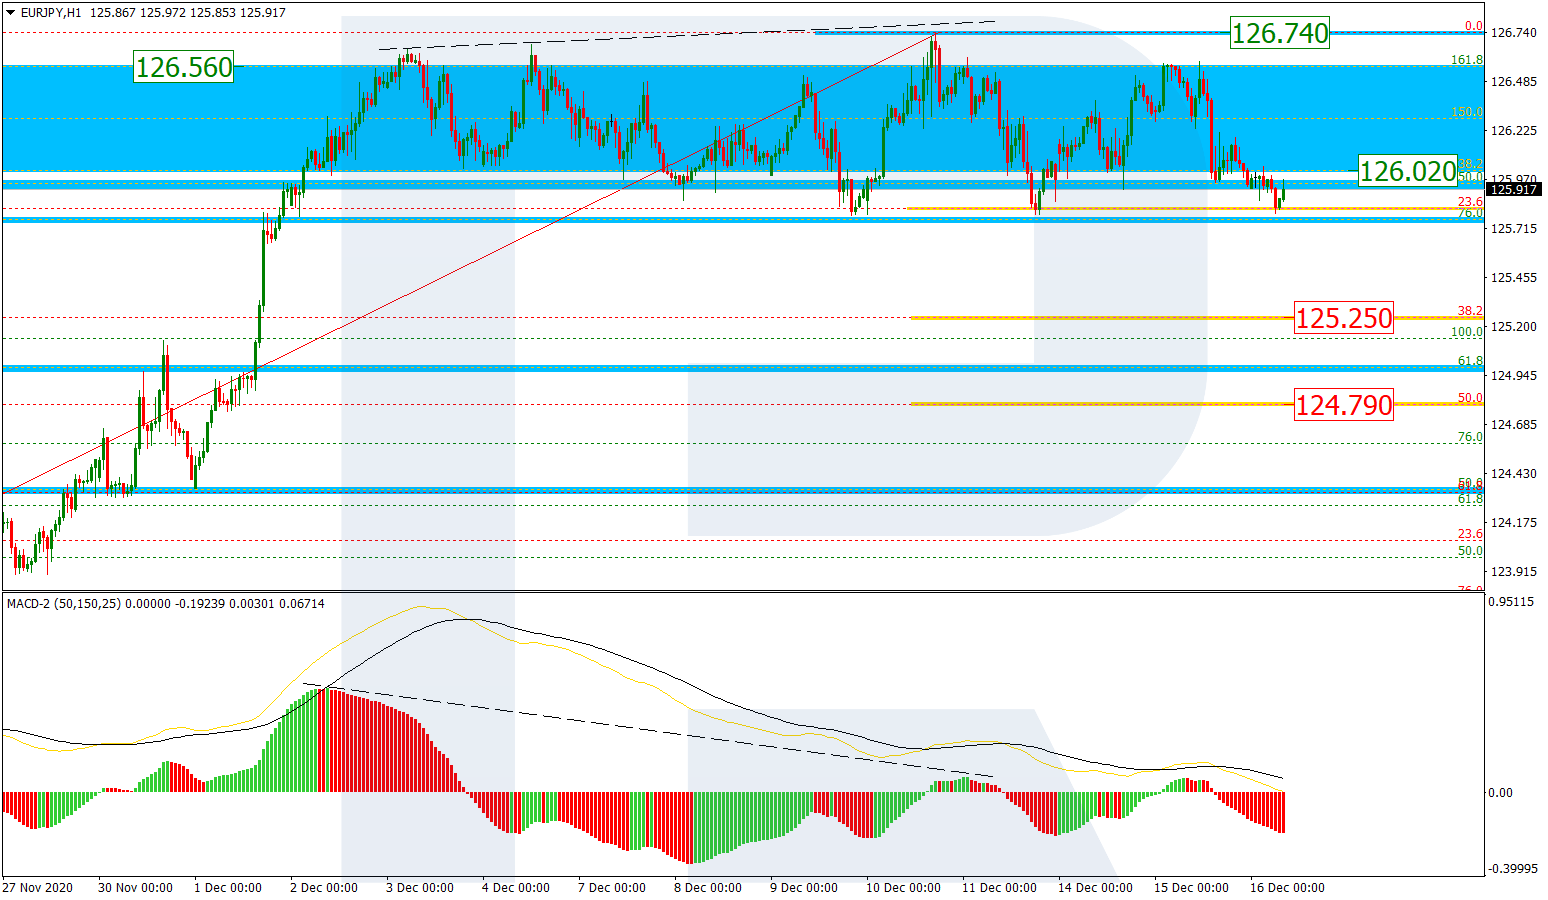
As we can see in the H1 chart, the asset is moving inside the same post-correctional extension area between 138.2% and 161.8% fibo at 126.02 and 126.56 respectively. However, this decline is a part of the correction that started after a divergence on MACD. The correctional downtrend has already tested 23.6% fibo twice and, after breaking it, may continue falling towards 38.2% and 50.0% fibo at 125.25 and 124.79 respectively. A breakout of the local high at 126.74 will hint at further uptrend.
Article By RoboForex.com
Attention!
Forecasts presented in this section only reflect the author’s private opinion and should not be considered as guidance for trading. RoboForex LP bears no responsibility for trading results based on trading recommendations described in these analytical reviews.

- This “Bullish Buzz” Reaches Highest Level in 53 Years Apr 26, 2024
- FastSpring and EBANX Forge Partnership to Expand Pix Payments for Digital Products in Brazil Apr 25, 2024
- Target Thursdays: NAS100, Robusta Coffee, USDCHF Apr 25, 2024
- QCOM wants to create competition in the AI chip market. Hong Kong index hits five-month high Apr 25, 2024
- Japanese yen hits all-time low as BoJ meeting commences Apr 25, 2024
- TSLA shares rose on a weak report. Inflationary pressures are easing in Australia Apr 24, 2024
- USDJPY: On intervention watch Apr 24, 2024
- Euro gains against the dollar amid mixed economic signals Apr 24, 2024
- PMI data is the focus of investors’ attention today. Turkey, Iraq, Qatar, and UAE signed a transportation agreement Apr 23, 2024
- Australian dollar rises on strong economic indicators Apr 23, 2024