
Article By RoboForex.com
BTCUSD, “Bitcoin vs US Dollar”
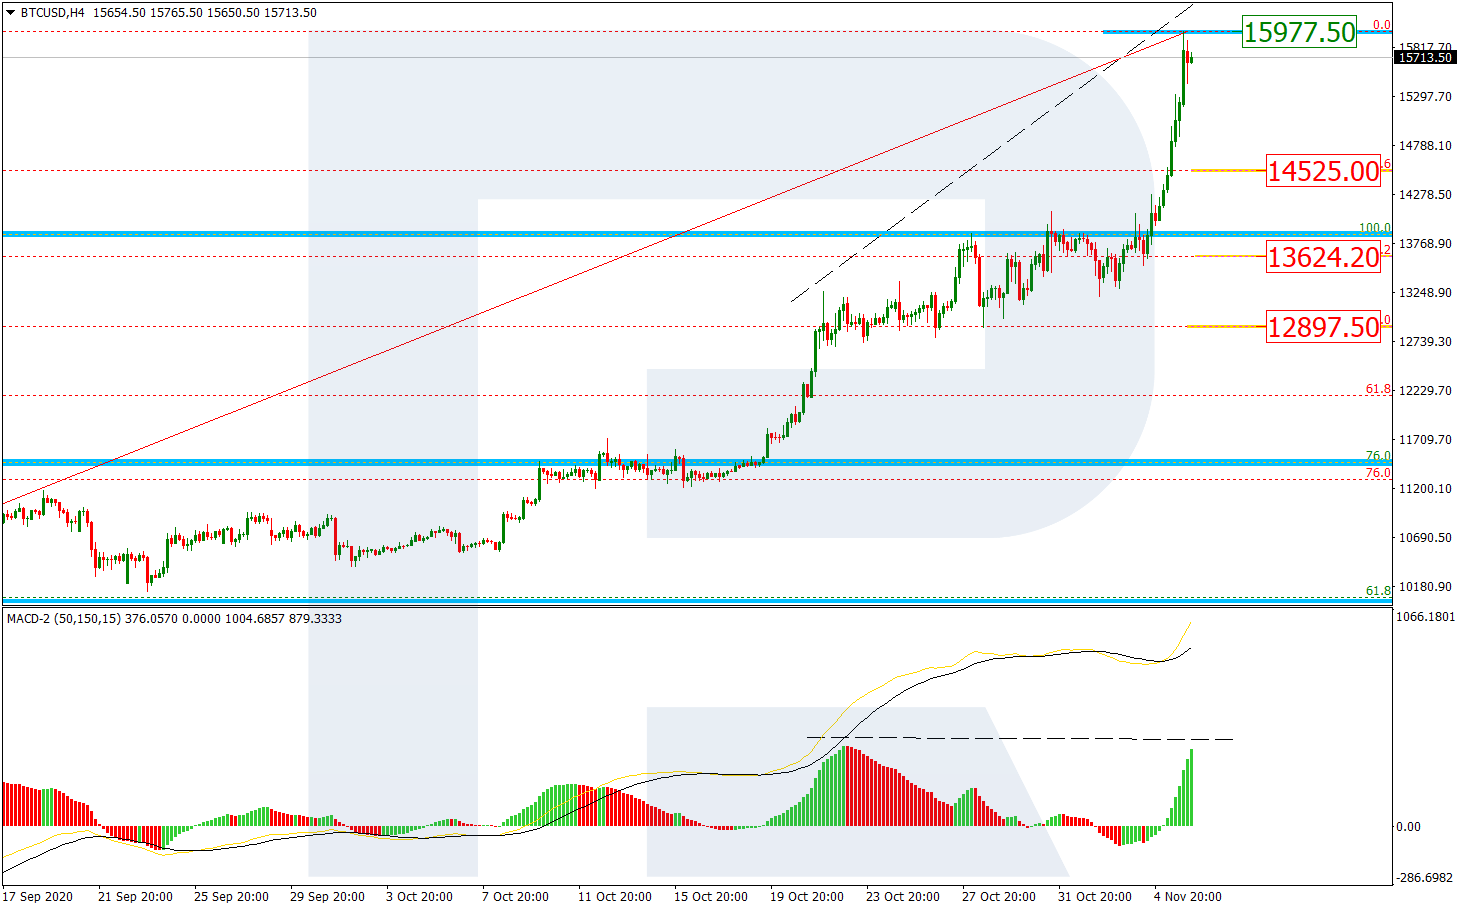
In the daily chart, after updating its two-year high, BTCUSD continues the uptrend and has already tested 16000.00. The next upside targets are inside the post-correctional extension area between 138.2% and 161.8% fibo at 17626.00 and 20022.00 respectively. If the asset decides to start a new pullback, its target will be at 13857.20.


The H1 chart shows a divergence on MACD. In this case, the pair is expected to start a descending correction towards 23.6%, 38.2%, and 50.0% fibo at 14525.00, 13624.20, and 12897.50 respectively. The resistance is the high at 15977.50.
Free Reports:
 Get our Weekly Commitment of Traders Reports - See where the biggest traders (Hedge Funds and Commercial Hedgers) are positioned in the futures markets on a weekly basis.
 Download Our Metatrader 4 Indicators – Put Our Free MetaTrader 4 Custom Indicators on your charts when you join our Weekly Newsletter
ETHUSD, “Ethereum vs. US Dollar”
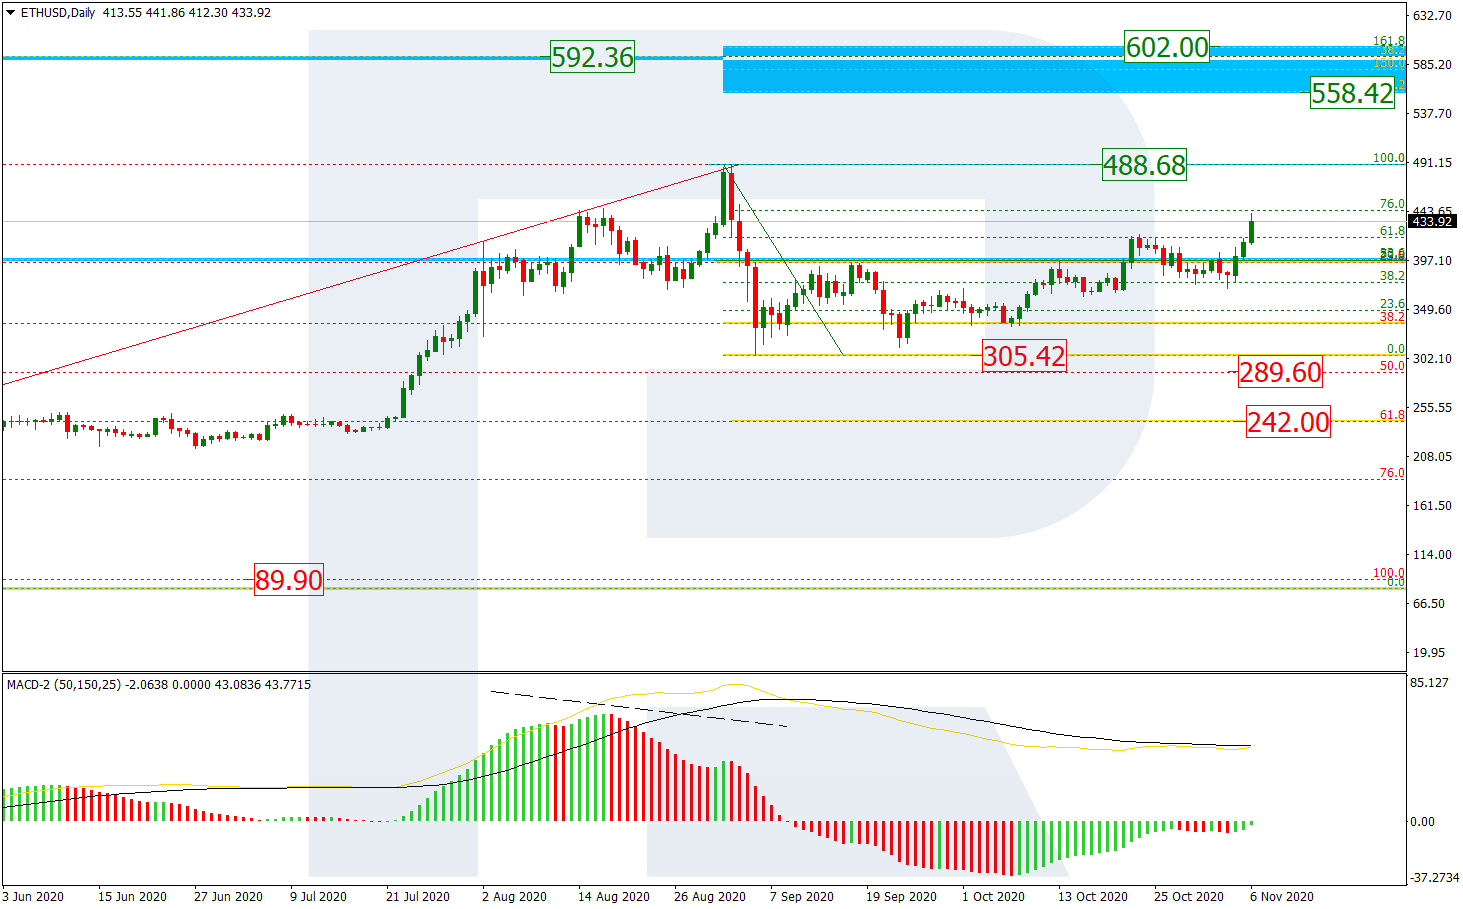
Ethereum clearly wants to keep pace with Bitcoin but as long as the cryptocurrency is trading below the high at 488.68, the correction won’t be over. As we can see in the daily chart, after the first descending correctional wave reached 38.2% fibo, the second one has broken the low at 305.42 and may later reach 50.0% and 61.8% fibo at 289.60 and 242.00 respectively. However, if the asset breaks the high after all, the instrument may continue growing to reach the long-term 38.2% fibo at 592.36, as well as the post-correctional extension area between 138.2% and 161.8% fibo at 558.42 and 602.00 respectively.
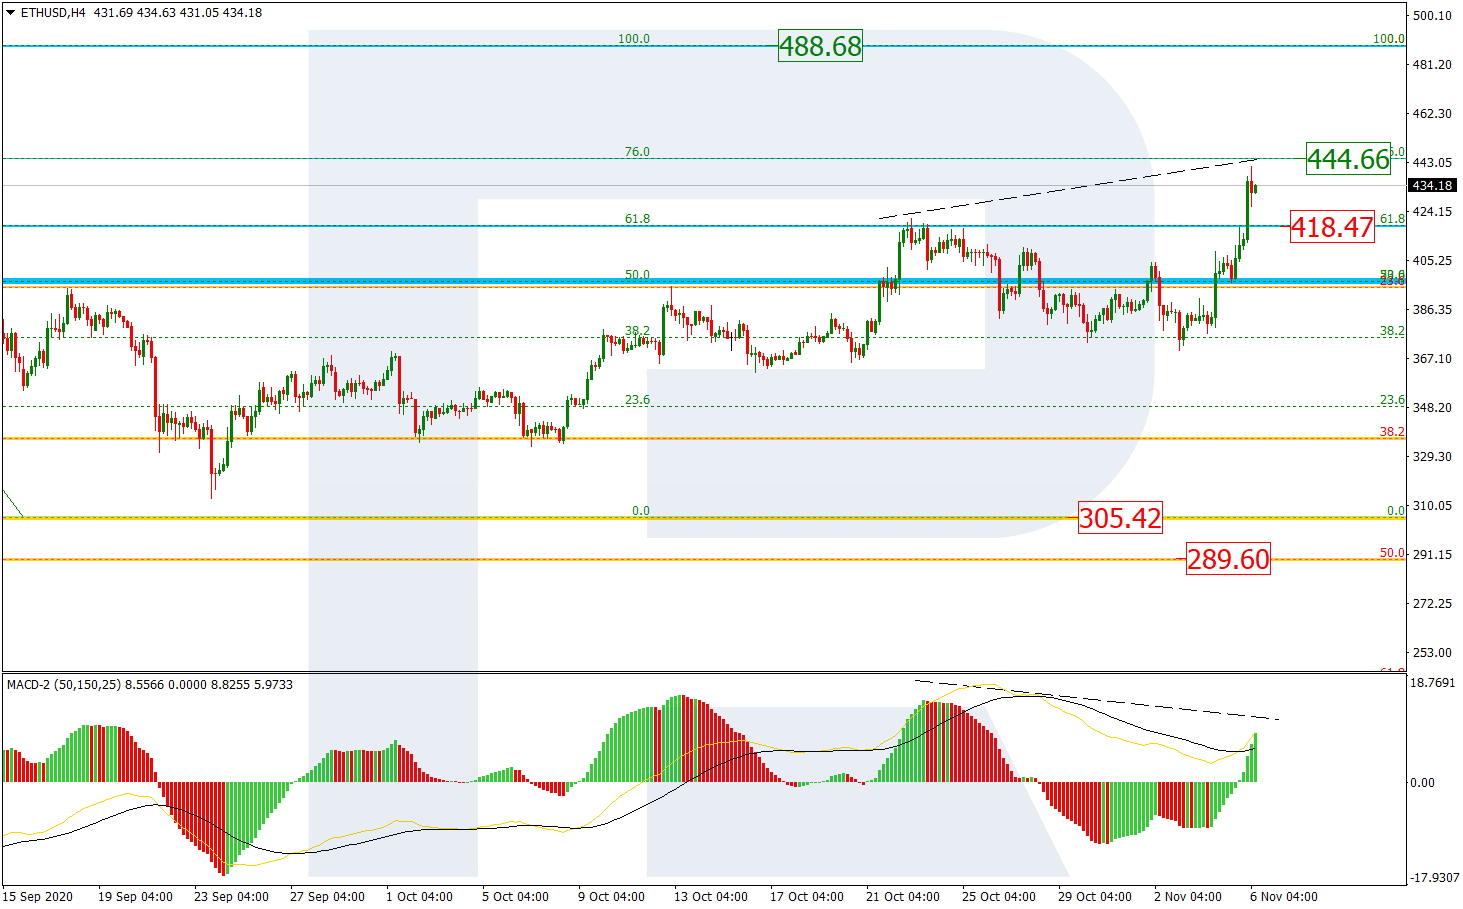
In the H1 chart, the ascending correction is approaching 76.0% fibo at 444.66. Taking into account a divergence on MACD, in the nearest future, the asset may start a new decline towards 61.8% fibo at 418.47, which was broken earlier.
Article By RoboForex.com
Attention!
Forecasts presented in this section only reflect the author’s private opinion and should not be considered as guidance for trading. RoboForex LP bears no responsibility for trading results based on trading recommendations described in these analytical reviews.

- 3 Signs of Developing U.S. Economic Slowdown Apr 19, 2024
- Israel has retaliated against Iran. Investors run to safe assets Apr 19, 2024
- Gold hits record high amid growing geopolitical tensions Apr 19, 2024
- The US natural gas prices fell to a 2-month low. A drop in the technology sector on Wednesday had a negative impact on the broad market Apr 18, 2024
- Target Thursdays: Cocoa, Bitcoin and USDCHF hit targets! Apr 18, 2024
- British Pound shows signs of recovery amid favourable inflation data Apr 18, 2024
- Indices decline amid hawkish comments from the Fed. Investors are waiting for Israel’s answer Apr 17, 2024
- EURGBP: Slams into support on hot UK inflation Apr 17, 2024
- Brent crude prices dip amid concerns over global demand Apr 17, 2024
- Stock indices sell-off amid rising geopolitical tensions in the Middle East. China’s GDP grew the most in a year Apr 16, 2024