
Author: Dmitriy Gurkovskiy, Chief Analyst at RoboForex
Early in another November week, the major currency pair is still moving upwards and mostly trading at 1.1890. Investors are obviously in favor of risks.
Joe Biden’s election victory in the USA put significant pressure on the American currency: market players are expecting Biden to promote more active stimulus measures to support the country’s economy. And that’s not good for the “greenback”.
The statistics published by the USA last Friday were quite positive. The Unemployment Rate dropped to 6.9% in October against the expected reading of 7.7%. Another report, the Non-Farm Employment Change, showed 638K against market expectations of 600K.
This week, EUR/USD will remain highly volatile. Apart from the statistics, investors will closely watch US policymakers’ speeches and comments, as well as what is going to happen in the US Congress. All this will clearly provide a lot of options for sharp fluctuations.
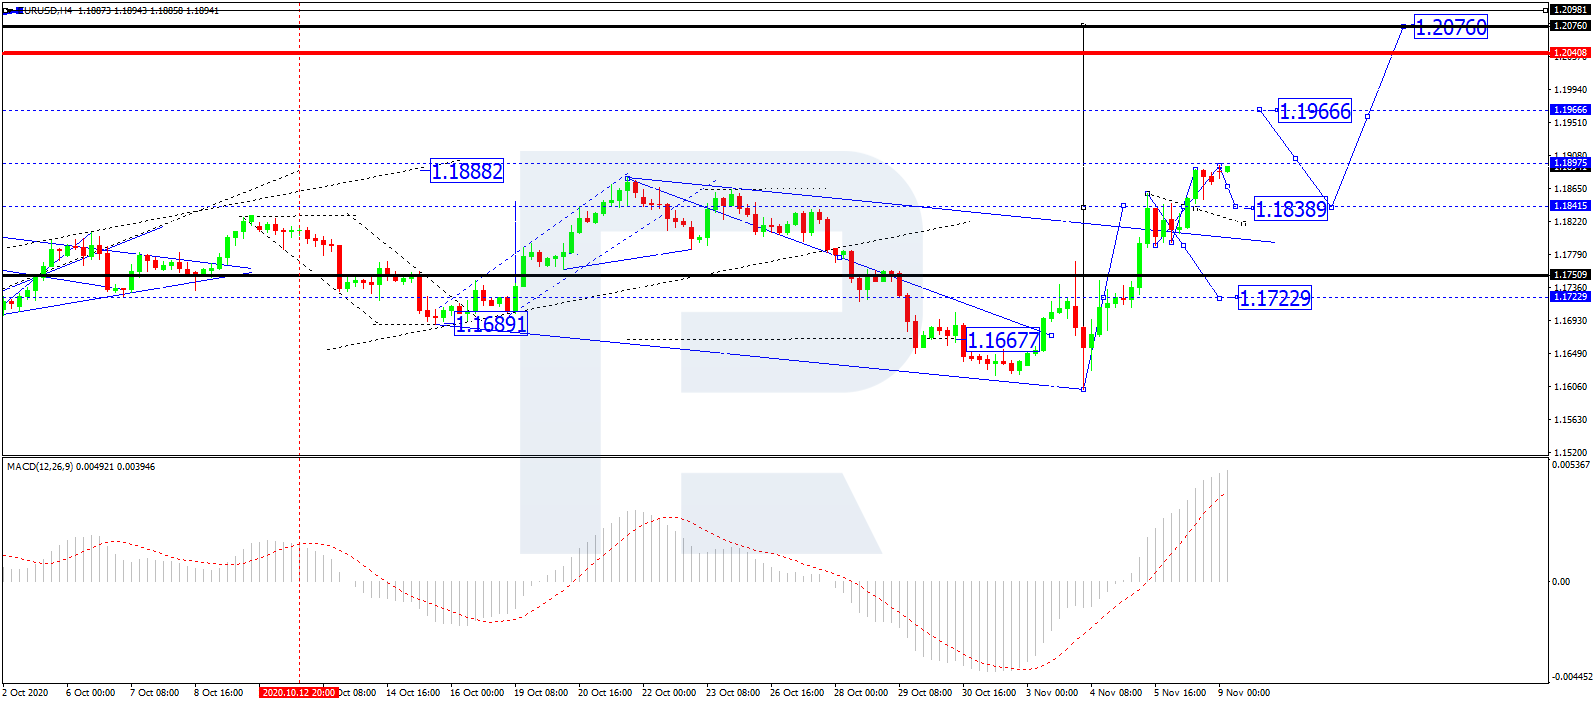
In the H4 chart, EUR/USD has completed the ascending wave at 1.1850; right now, it is forming a consolidation range around this level, which may be considered as an upside continuation pattern. Possibly, the pair may extend this wave up to 1.1967 or even continue growing with the target at 1.2070. From the technical point of view, this scenario is confirmed by MACD Oscillator: after breaking 0 to the upside, its signal line is steadily moving upwards inside the histogram area.
Free Reports:
 Get our Weekly Commitment of Traders Reports - See where the biggest traders (Hedge Funds and Commercial Hedgers) are positioned in the futures markets on a weekly basis.
 Sign Up for Our Stock Market Newsletter – Get updated on News, Charts & Rankings of Public Companies when you join our Stocks Newsletter
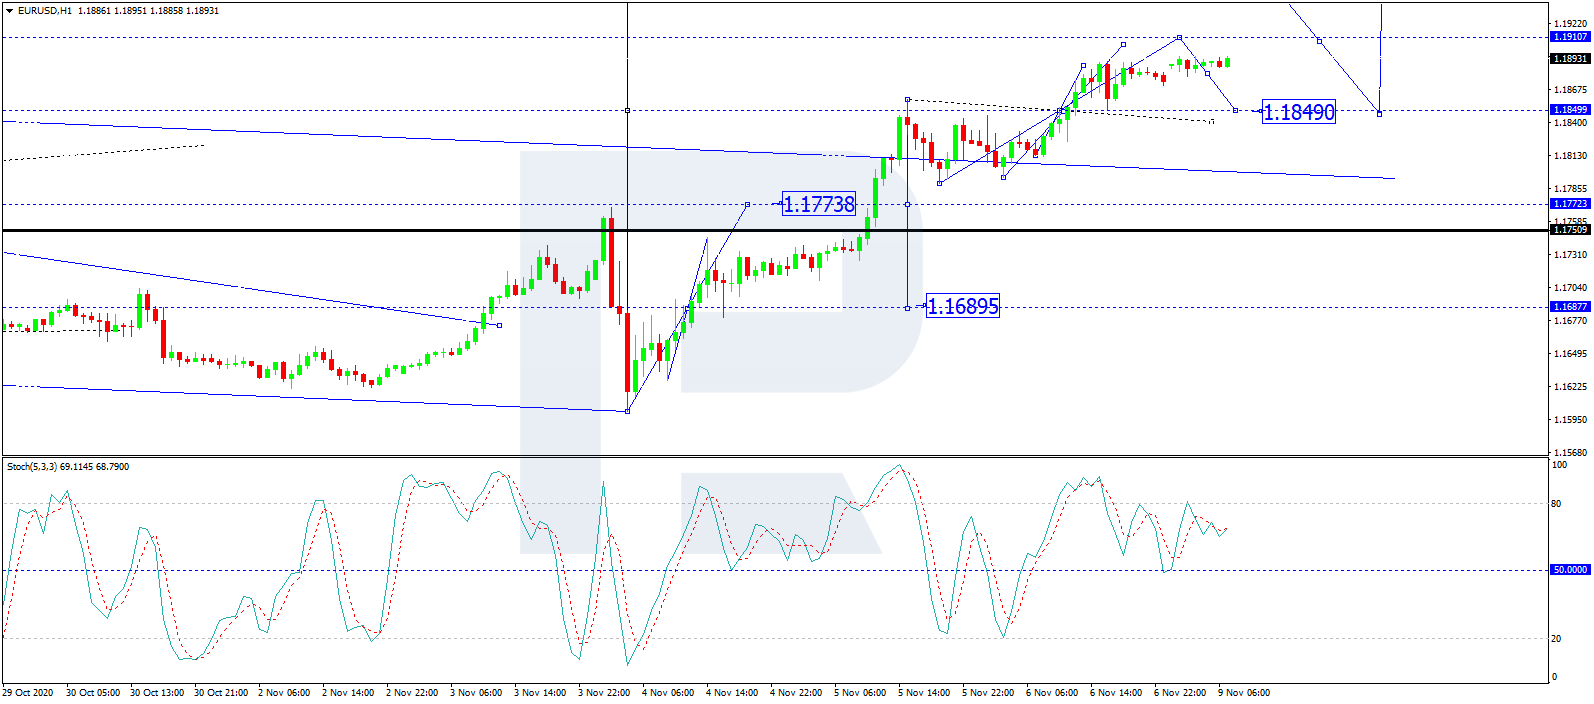
As we can see in the H1 chart, after breaking 1.1850 to the upside, EUR/USD may continue growing towards 1.1910. After that, the instrument may correct to test 1.1850 from above and then form one more ascending structure to reach 1.1960. Later, the market may start another correction to return to 1.1850 once again. From the technical point of view, this scenario is confirmed by Stochastic Oscillator: its signal line is falling towards 50, thus implying further decline to reach 1.1850 on the price chart. After that, the line is expected to grow towards 80.
Disclaimer
Any forecasts contained herein are based on the author’s particular opinion. This analysis may not be treated as trading advice. RoboForex bears no responsibility for trading results based on trading recommendations and reviews contained herein.

- Indices decline amid hawkish comments from the Fed. Investors are waiting for Israel’s answer Apr 17, 2024
- EURGBP: Slams into support on hot UK inflation Apr 17, 2024
- Brent crude prices dip amid concerns over global demand Apr 17, 2024
- Stock indices sell-off amid rising geopolitical tensions in the Middle East. China’s GDP grew the most in a year Apr 16, 2024
- New FXTM commodity hits all-time high! Apr 16, 2024
- NZD hits five-month low against strong US dollar Apr 16, 2024
- Escalating conflict in the Middle East is forcing investors to shift funds to safe assets Apr 15, 2024
- US dollar exhibits remarkable strength amid global tensions Apr 15, 2024
- COT Metals Charts: Speculator bets led higher by Copper & Platinum Apr 13, 2024
- COT Bonds Charts: Speculator Bets led by 10-Year & 5-Year Bonds Apr 13, 2024