
– If I put the pandemic aside and ignore the current jobs picture there are many reasons that I am bullish stocks. Housing continues to remain upbeat with sales near all-time highs and consumer confidence is rising, which means investors’ sentiment will continue to trend higher. What is most important is that stocks that have outperformed in 2020 will likely continue to outperform. So my goal is to focus on the winners and avoid the laggers.
The Election Does Not Matter
It seems clear that investors don’t seem to care who wins the election. Biden is up in the polls, and even though he has repeatedly said that he will raise taxes, the market does not seem to care. If Biden wins he will sign a huge stimulus bill and likely go for an enormous infrastructure spending bill that will propel stocks even higher. If President Trump is reelected, I also expect a stimulus bill with an eventual tax cut. While at Walter Reed Hospital, President Trump tweeted that if he wins he will push for the biggest tax cut in history. The bottom line is that regardless of who wins the presidency, stock prices are likely to continue to trend higher and ignore the weakening economic climate.
Large Cap Tech and New Economy Stocks Will Continue to Outperform
What is clear is that the spread of COVID-19 has a stranglehold on businesses and shoppers. This has led to the outperformance of large-cap tech shares like Amazon, Apple, Microsoft, and Google. It has also propelled stay at home stocks such as Zoom, Peloton, and Netflix. Large-cap tech shares have gained substantial market capitalization and their continued outperformance will be the impetus that drives the broader markets. In both market-cap-weighted indexes (like the S&P 500 index) and price-weighted indices (like the Dow Industrial Average), large-cap tech shares have become the key drivers of the value of these indices.
Stay with Clean Energy and Discard Dirty Energy
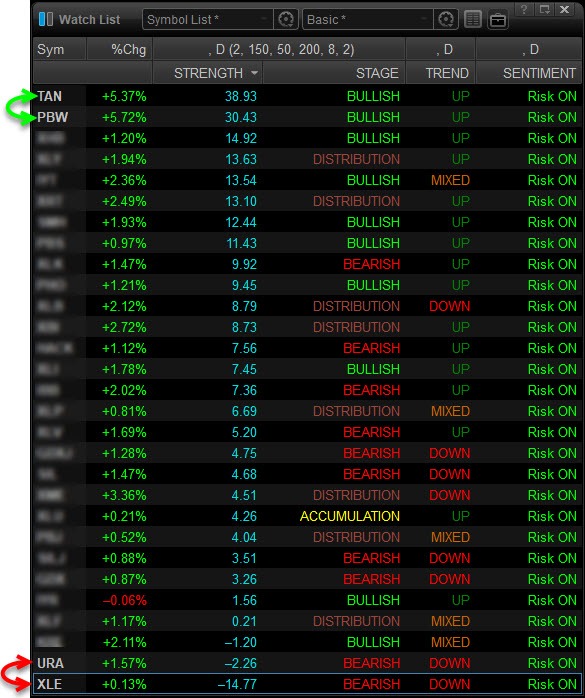
An interesting sub-sector in the energy space that has been silently leading the way higher are solar stocks. TAN (Investco Solar ETF) is a solar exchange-traded fund that has significantly outperformed every other asset. Another is the clean energy ETF PBW. These two are the BAN (Best Asset Now)
The worst performing sector in the S&P 500 index is the XLE (Energy Select SPDR), which is considered dirty energy. Second worst performer is the URA which holds uranium equities which is also considered dirty energy.
Free Reports:
 Get our Weekly Commitment of Traders Reports - See where the biggest traders (Hedge Funds and Commercial Hedgers) are positioned in the futures markets on a weekly basis.
 Sign Up for Our Stock Market Newsletter – Get updated on News, Charts & Rankings of Public Companies when you join our Stocks Newsletter
Be sure to sign up for our free market trend analysis and signals now so you don’t miss our next special report!
The way I evaluate stocks is by using a (Best Asset Now) BAN strategy where I focus on owning leaders and discarding laggards. I have found that over time, stock/sectors that have been leading the broader markets for 3-4 months have a 70% probability to continue to trend higher. That is why I like to own them on a breakout or buy them on oversold dips.
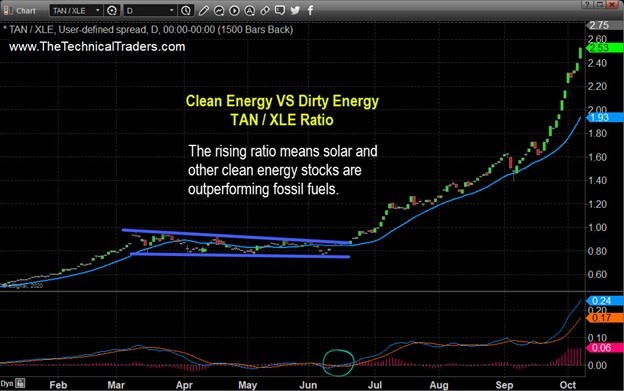
Daily Clean VS Dirty Energy Ratio Chart
The way I evaluate the trend is to look at a chart of the outperformers as a ratio to the underperformers.
When I look at the chart of TAN/XLE (clean energy divided by dirty energy), I can see that the ratio has broken out and has increased more than 4-fold so far in 2020. Since breaking out in June, the ratio has revisited the 20-day moving average of the ratio 3-times, and each time the ratio bounced and accelerate higher. The momentum on the ratio is positive. The MACD (moving average convergence divergence) generated a crossover buy signal in late September.
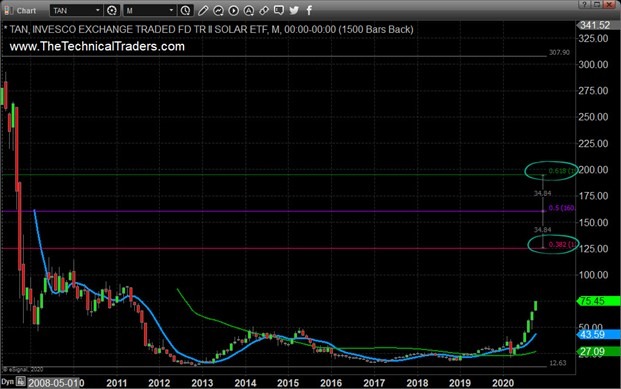
Monthly Solar Stock Sector Performance
The monthly chart of TAN shows there is a lot of room to rally before key target resistance. The Fibonacci retracement level from the highs made in 2008 to the lows made in 2013 shows that a 38.2% retracement level is at $125.96. If the price of TAN can clear the 38.2% retracement level the next stop could be the 61.8% retracement level near $195.38. The 20-month moving average of TAN crossed above the 50-month moving average of TAN which means that a long-term uptrend is now in place.
Be sure to sign up for our free market trend analysis and signals now so you don’t miss our next special report!
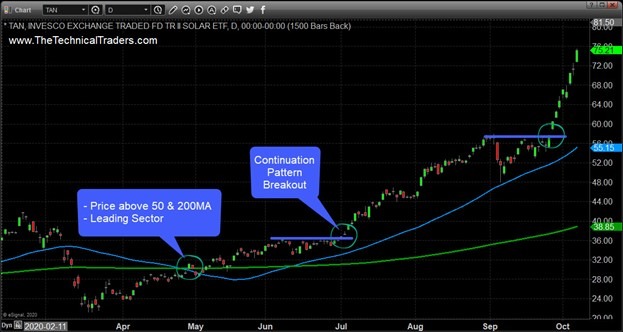
TAN Solar Breakout – Daily Chart
TAN broke out in late September and has not looked back. After gaping through and closing above the key 50 and 200 moving averages, the price climbed in a steady and sustailable rate. Since gapping above the $58 resistance leve the price has surged higher on heavy volume.
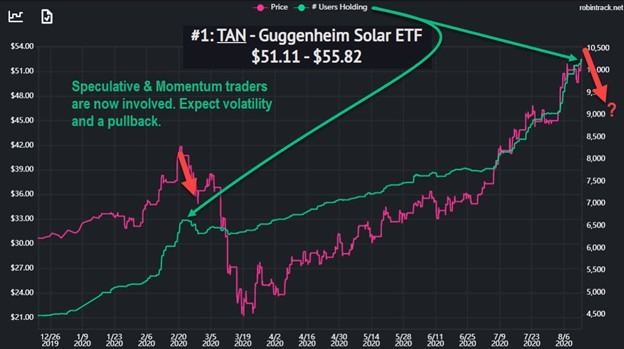
RobinHood Traders Piling Into TAN Clean Energy Sector
Take a look at this chart below which shows the price of TAN in pink, and the number of traders who own this ETF in green. The key takeaway from this chart is that when we see short-term speculative traders piling into an asset as they did during February, and again now, you should expect wild price swings and some type of pullback in the near future that could last a few weeks or months.
Concluding Thoughts
In short, clean energy is likely to continue to outperform the broader market’s energy regardless of who wins the Presidency, but there may be a few bumps to avoid over in the near term. If I put the pandemic aside, and focus on the positive aspects of the economy, there are a lot of reasons to be bullish stocks. While clean energy has been the leader up until now, new sectors are starting to show signs of new leadership.
Congress is eventually going to pull the trigger on another stimulus bill which will ignite a new bull trend I would expect. My strategy is to use (BAN) Best Assets Now, evaluating sectors for who we should be looking to own.
As a technical analyst and trader since 1997, I have been through a few bull/bear market cycles in stocks and commodities. I believe I have a good pulse on the market and timing key turning points for investing and short-term swing traders. 2020 is an incredible year for traders and investors. Don’t miss all the incredible trends and trade setups.
If you want to survive the trading over a long period of time, then you learn fairly quickly how important it is to protect against risk and to properly size your trades. Subscribers of my Active ETF Swing Trading Newsletter can ride my coattails as I navigate these financial markets and build wealth. My research and trading team are here to help you find better trades and navigate these incredibly crazy market trends.
While most of us have active trading accounts, what is even more important are our long-term investment and retirement accounts. Why? Because they are, in most cases, our largest store of wealth other than our homes, and if they are not protected during the next bear market, you could lose 25-50% or more of your net worth. The good news is we can preserve and even grow our long-term capital when things get ugly (likely soon) and I will show you how. We’ve recently issued a Long-term Investment Signal for subscribers of our Technical Investor newsletter. Be sure to become a member of my Passive Long-Term ETF Investing Signals.
Chris Vermeulen
Chief Market Strategies
Founder of Technical Traders Ltd.
NOTICE AND DISCLAIMER: Our free research does not constitute a trade recommendation or solicitation for our readers to take any action regarding this research. It is provided for educational purposes only – read our FULL DISCLAIMER here. Visit TheTechnicalTraders.com to learn how to take advantage of our members-only research and trading signals.

- Target Thursdays: Cocoa, Bitcoin and USDCHF hit targets! Apr 18, 2024
- British Pound shows signs of recovery amid favourable inflation data Apr 18, 2024
- Indices decline amid hawkish comments from the Fed. Investors are waiting for Israel’s answer Apr 17, 2024
- EURGBP: Slams into support on hot UK inflation Apr 17, 2024
- Brent crude prices dip amid concerns over global demand Apr 17, 2024
- Stock indices sell-off amid rising geopolitical tensions in the Middle East. China’s GDP grew the most in a year Apr 16, 2024
- New FXTM commodity hits all-time high! Apr 16, 2024
- NZD hits five-month low against strong US dollar Apr 16, 2024
- Escalating conflict in the Middle East is forcing investors to shift funds to safe assets Apr 15, 2024
- US dollar exhibits remarkable strength amid global tensions Apr 15, 2024