
 Source: Economic Events October 28, 2020 – Admiral Markets’ Forex Calendar
While Gold is still waiting for impulses and continues to trade around 1,900 USD, tensions are building and sooner than later traders can expect a sharp increase in volatility.
While a potential trigger event is certainly the upcoming US presidential election on the 03rd of November (next Tuesday), it is not guaranteed due to a sharp rise in regards to risk appetite, respectively risk aversion, among market participants.
While Democrats and Republicans have not yet agreed on a deal for an economic relief package, it seems traders should prepare to see Nancy Pelosi and Steven Mnuchin come up with an optimistic outlook on continued stimulus talks right after polls are closed on Election Day.
As we already pointed out, a final deal between Democrats and Republicans will potentially fall into a time which is historically known to be bullish for Gold from a seasonal perspective (December/January). This could drive the price of Gold significantly back above 2,000 USD – only with a small delay.
Free Reports:
 Get our Weekly Commitment of Traders Reports - See where the biggest traders (Hedge Funds and Commercial Hedgers) are positioned in the futures markets on a weekly basis.
 Download Our Metatrader 4 Indicators – Put Our Free MetaTrader 4 Custom Indicators on your charts when you join our Weekly Newsletter
In fact, extending this seasonal view on the yellow metal shows that the current “weakness” in Gold has usually been a good buying opportunity, at least in the time period from October 1986 to now.
Still, we remain cautious in regard to long engagements below 1,975 USD on a daily time-frame, but keep this level in mind since it could be the initial bullish catalyst that drives Gold up to its current yearly and All-Time highs around 2,075 USD or even higher:
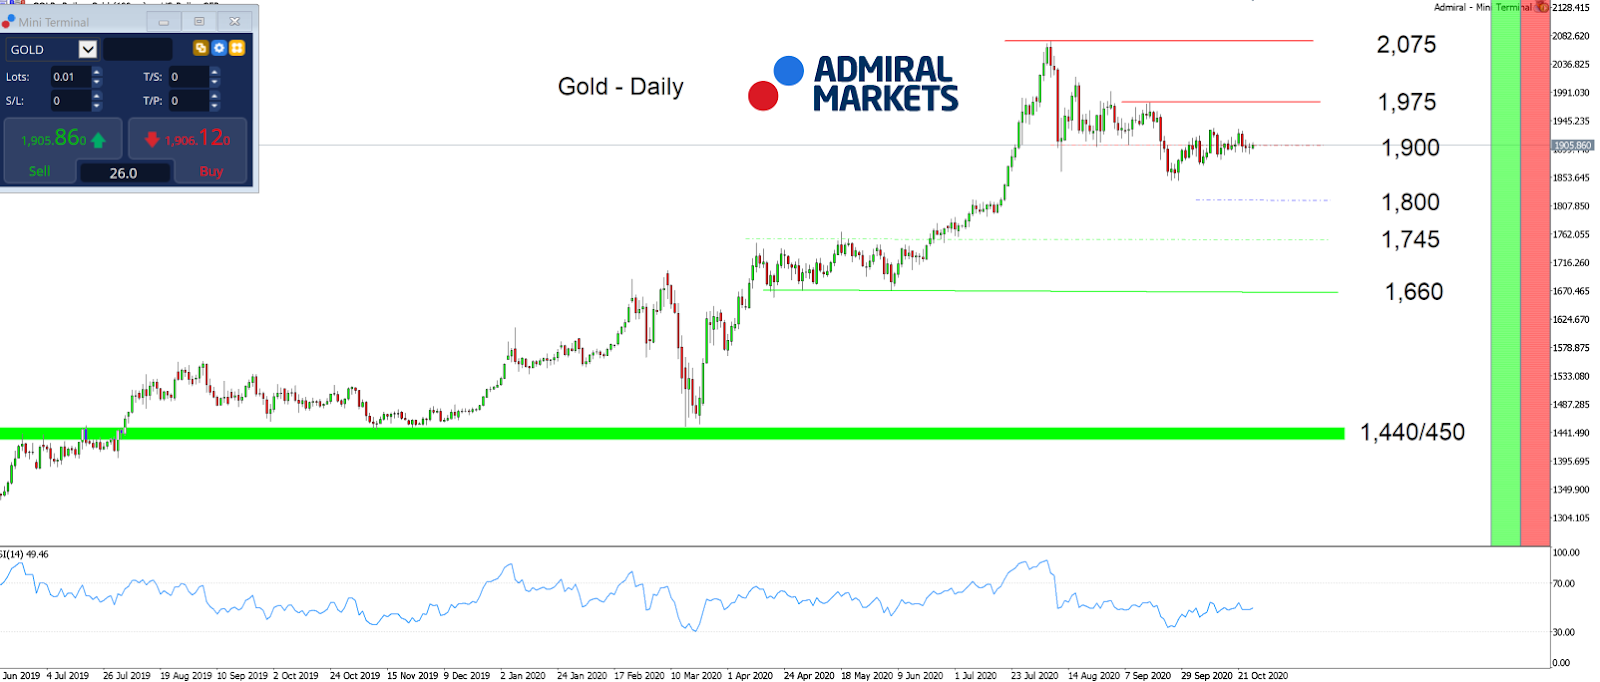 Source: Admiral Markets MT5 with MT5SE Add-on Gold Daily chart (between June 12, 2019, to October 27, 2020). Accessed: October 27, 2020, at 10:00 PM GMT. Please note: Past performance is not a reliable indicator of future results, or future performance.
In 2015, the value of Gold fell by 10.4%, in 2016, it increased by 8.1%, in 2017, it increased by 13.1%, in 2018, it fell by 1.6%, and in 2019, it increased by 18.9%, meaning that in five years, it was up by 28%.
Discover the world’s #1 multi-asset platform
Admiral Markets offers professional traders the ability to trade with MetaTrader 5, allowing you to experience trading at a significantly higher, more rewarding level than with MetaTrader 4. Experience benefits such as the addition of the Market Heat Map, so you can compare various currency pairs to see which ones might be lucrative investments, access real-time trading data, and so much more. Click the banner below to start your FREE download of MT5!

Disclaimer: The given data provides additional information regarding all analysis, estimates, prognosis, forecasts or other similar assessments or information (hereinafter “Analysis”) published on the website of Admiral Markets. Before making any investment decisions please pay close attention to the following:
- This is a marketing communication. The analysis is published for informative purposes only and is in no way to be construed as investment advice or recommendation. It has not been prepared in accordance with legal requirements designed to promote the independence of investment research, and that it is not subject to any prohibition on dealing ahead of the dissemination of investment research.
- Any investment decision is made by each client alone whereas Admiral Markets shall not be responsible for any loss or damage arising from any such decision, whether or not based on the Analysis.
- Each of the Analysis is prepared by an independent analyst (Jens Klatt, Professional Trader and Analyst, hereinafter “Author”) based on the Author’s personal estimations.
- To ensure that the interests of the clients would be protected and objectivity of the Analysis would not be damaged Admiral Markets has established relevant internal procedures for prevention and management of conflicts of interest.
- Whilst every reasonable effort is taken to ensure that all sources of the Analysis are reliable and that all information is presented, as much as possible, in an understandable, timely, precise and complete manner, Admiral Markets does not guarantee the accuracy or completeness of any information contained within the Analysis. The presented figures that refer to any past performance is not a reliable indicator of future results.
- The contents of the Analysis should not be construed as an express or implied promise, guarantee or implication by Admiral Markets that the client shall profit from the strategies therein or that losses in connection therewith may or shall be limited.
- Any kind of previous or modelled performance of financial instruments indicated within the Publication should not be construed as an express or implied promise, guarantee or implication by Admiral Markets for any future performance. The value of the financial instrument may both increase and decrease and the preservation of the asset value is not guaranteed.
- The projections included in the Analysis may be subject to additional fees, taxes or other charges, depending on the subject of the Publication. The price list applicable to the services provided by Admiral Markets is publicly available from the website of Admiral Markets.
- Leveraged products (including contracts for difference) are speculative in nature and may result in losses or profit. Before you start trading, you should make sure that you understand all the risks.

- Stock indices sell-off amid rising geopolitical tensions in the Middle East. China’s GDP grew the most in a year Apr 16, 2024
- New FXTM commodity hits all-time high! Apr 16, 2024
- NZD hits five-month low against strong US dollar Apr 16, 2024
- Escalating conflict in the Middle East is forcing investors to shift funds to safe assets Apr 15, 2024
- US dollar exhibits remarkable strength amid global tensions Apr 15, 2024
- COT Metals Charts: Speculator bets led higher by Copper & Platinum Apr 13, 2024
- COT Bonds Charts: Speculator Bets led by 10-Year & 5-Year Bonds Apr 13, 2024
- COT Soft Commodities Charts: Speculator Bets led by Soybean Meal & Lean Hogs Apr 13, 2024
- COT Stock Market Charts: Weekly Speculator Bets led by VIX & S&P500-Mini Apr 13, 2024
- Singapore’s central bank (MAS) maintained its monetary policy settings. The ECB hinted at a rate cut soon Apr 12, 2024