
| Indicator | Value | Signal |
| RSI | Neutral | |
| MACD | Buy | |
| MA(200) | Neutral | |
| Fractals | Buy | |
| Parabolic SAR | Buy | |
| Bollinger Bands | Buy |
Chart Analysis
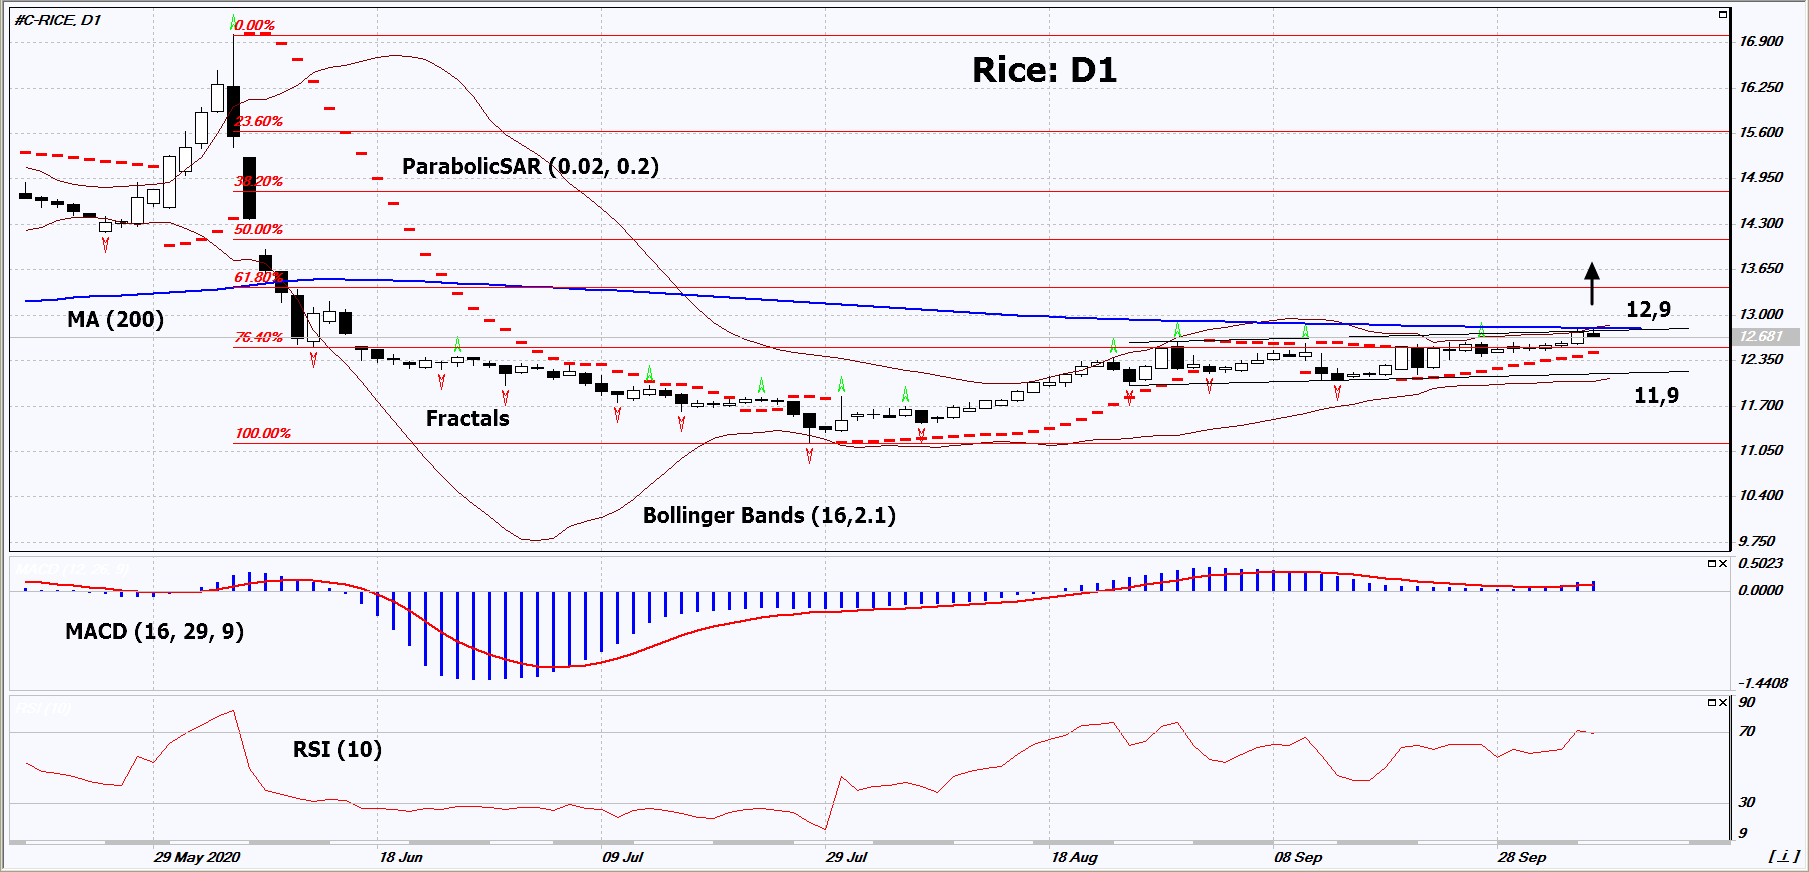
On the daily timeframe, Rice: D1 exceeded the last 3 upper fractals and approached the upper border of the ascending channel. It must be broken upward before opening a position. A number of technical analysis indicators formed signals for further growth. We do not rule out a bullish move if Rice rises above the 200-day moving average line and the upper Bollinger band: 12.9. This level can be used as an entry point. We can set a stop loss below the Parabolic signal, the lower Bollinger band and the last 3 lower fractals: 11.9. After opening a pending order, we move the stop loss to the next fractal low following the Bollinger and Parabolic signals. Thus, we change the potential profit/loss ratio in our favor. After the transaction, the most risk-averse traders can switch to the four-hour chart and set a stop loss, moving it in the direction of the bias. If the price meets the stop loss (11.9) without activating the order (12.9), it is recommended to delete the order: the market sustains internal changes that have not been taken into account.
Fundamental Analysis
Rainy weather in India can damage crops. Will Rice quotes grow ?
Market Analysis provided by IFCMarkets.com

- Target Thursdays: NAS100, Robusta Coffee, USDCHF Apr 25, 2024
- QCOM wants to create competition in the AI chip market. Hong Kong index hits five-month high Apr 25, 2024
- Japanese yen hits all-time low as BoJ meeting commences Apr 25, 2024
- TSLA shares rose on a weak report. Inflationary pressures are easing in Australia Apr 24, 2024
- USDJPY: On intervention watch Apr 24, 2024
- Euro gains against the dollar amid mixed economic signals Apr 24, 2024
- PMI data is the focus of investors’ attention today. Turkey, Iraq, Qatar, and UAE signed a transportation agreement Apr 23, 2024
- Australian dollar rises on strong economic indicators Apr 23, 2024
- Geopolitical risks in the Middle East are declining. China kept interest rates at lows Apr 22, 2024
- Brent crude dips to four-week low amid easing geopolitical tensions Apr 22, 2024