
Article By RoboForex.com
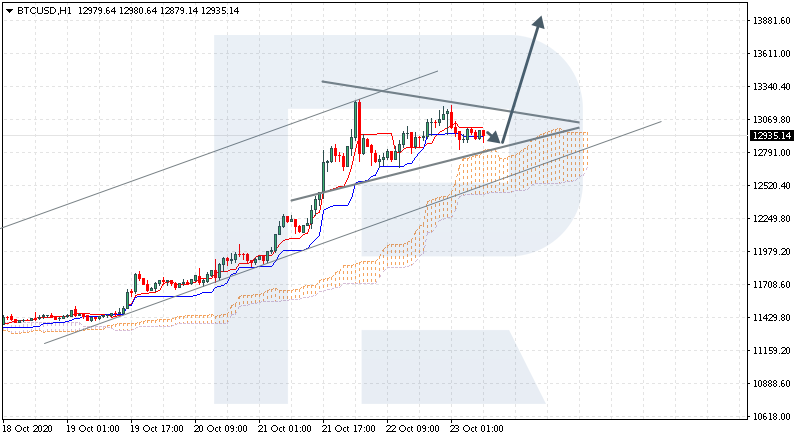
BTCUSD, “Bitcoin vs US Dollar”
BTCUSD is trading at 12935.00; the instrument is moving above Ichimoku Cloud, thus indicating an ascending tendency. As one can see, bulls haven’t been to fix above the resistance area at 13000.00 yet. The markets could indicate that the price may test the cloud’s upside border at 12805.00 and then resume moving upwards to reach 13885.00. Another signal in favor of further uptrend will be a rebound from the downside border of the Triangle pattern. However, the bullish scenario may no longer be valid if the price breaks the cloud’s downside border and fixes below 12225.00. In this case, the pair may continue falling towards 11605.00. To confirm further growth, the asset must break the pattern’s upside border and fix above 13340.00.

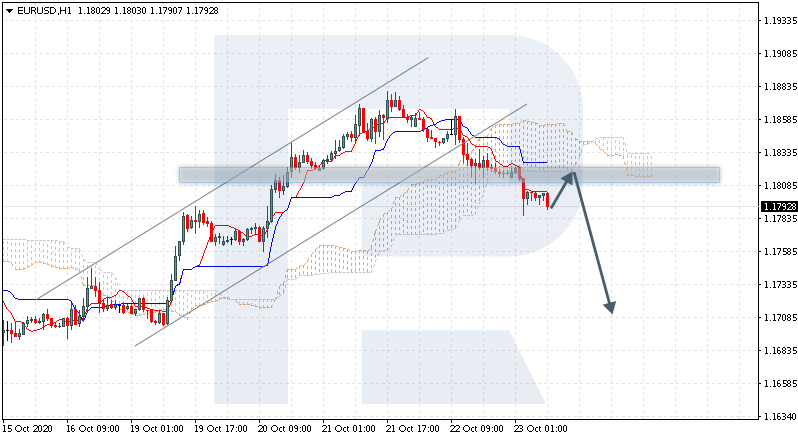
EURUSD, “Euro vs US Dollar”
EURUSD is trading at 1.1792; the instrument is moving below Ichimoku Cloud, thus indicating a descending tendency. The markets could indicate that the price may test the cloud’s downside border at 1.1810 and then resume moving downwards to reach 1.1705. Another signal in favor of further downtrend will be a rebound from the resistance level. However, the bearish scenario may be canceled if the price breaks the cloud’s upside border and fixes above 1.1865. In this case, the pair may continue growing towards 1.1955.
Free Reports:
 Sign Up for Our Stock Market Newsletter – Get updated on News, Charts & Rankings of Public Companies when you join our Stocks Newsletter
 Get our Weekly Commitment of Traders Reports - See where the biggest traders (Hedge Funds and Commercial Hedgers) are positioned in the futures markets on a weekly basis.
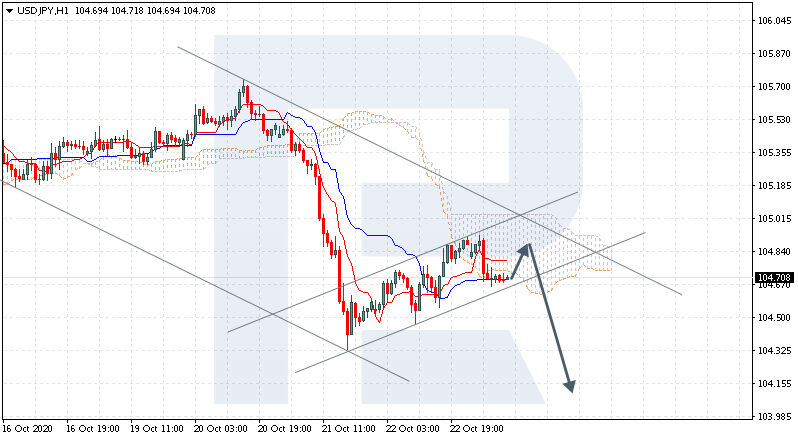
USDJPY, “US Dollar vs Japanese Yen”
USDJPY is trading at 104.70; the instrument is moving below Ichimoku Cloud, thus indicating a descending tendency. The markets could indicate that the price may test Tenkan-Sen and Kijun-Sen at 104.85 and then resume moving downwards to reach 104.05. Another signal in favor of further downtrend will be a rebound from the descending channel’s upside border. However, the bearish scenario may no longer be valid if the price breaks the cloud’s upside border and fixes above 105.20. In this case, the pair may continue growing towards 106.15. To confirm further decline, the asset must break the rising channel’s downside border and fix below 104.50.
Article By RoboForex.com
Attention!
Forecasts presented in this section only reflect the author’s private opinion and should not be considered as guidance for trading. RoboForex LP bears no responsibility for trading results based on trading recommendations described in these analytical reviews.

- Today, investors’ focus is on the PCE Price Index inflation report Apr 26, 2024
- Gold price recovers amid uncertain US economic outlook Apr 26, 2024
- This “Bullish Buzz” Reaches Highest Level in 53 Years Apr 26, 2024
- FastSpring and EBANX Forge Partnership to Expand Pix Payments for Digital Products in Brazil Apr 25, 2024
- Target Thursdays: NAS100, Robusta Coffee, USDCHF Apr 25, 2024
- QCOM wants to create competition in the AI chip market. Hong Kong index hits five-month high Apr 25, 2024
- Japanese yen hits all-time low as BoJ meeting commences Apr 25, 2024
- TSLA shares rose on a weak report. Inflationary pressures are easing in Australia Apr 24, 2024
- USDJPY: On intervention watch Apr 24, 2024
- Euro gains against the dollar amid mixed economic signals Apr 24, 2024