
By Han Tan, Market Analyst, ForexTime
The September selloff in US stocks doesn’t seem to be letting up.
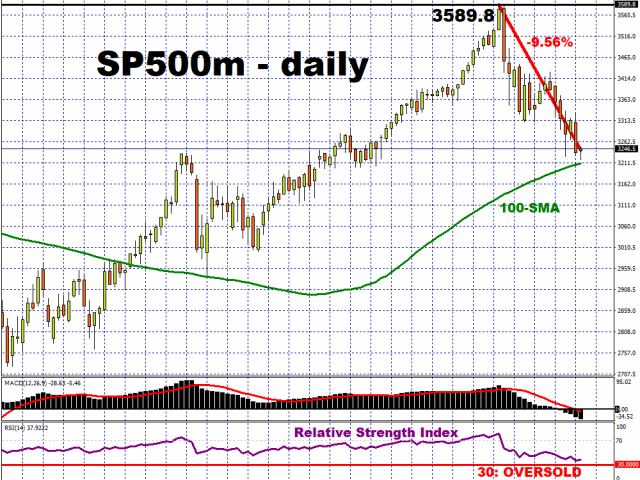
The S&P 500 is now flirting with a technical correction, which is when the price of an asset falls 10 percent or more from its recent high. The US benchmark equity index is now about 0.4 percentage points away from meeting that criteria, headed for its 100-day simple moving average (MA), with its futures flat during the Asian morning session.
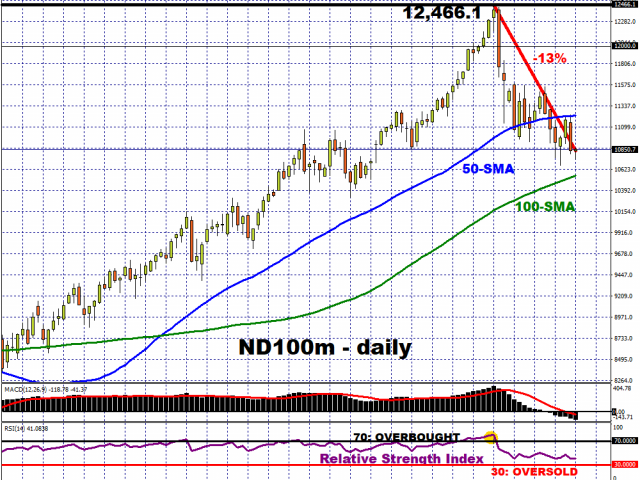
Wednesday’s US session also saw the Nasdaq 100 (NDX) posting its first daily loss so far this week, leaning further into its correction. The tech-heavy index is now 10.55 percent lower on a month-to-date basis, and has fallen by around 13 percent from its record high. The NDX also appears set on a path towards its 100-day simple moving average, although Nasdaq 100 minis are noticeably undecided about whether to extend losses at the time of writing. Still, its 50-day counterpart now provides immediate resistance.
Free Reports:
 Sign Up for Our Stock Market Newsletter – Get updated on News, Charts & Rankings of Public Companies when you join our Stocks Newsletter
 Get our Weekly Commitment of Traders Reports - See where the biggest traders (Hedge Funds and Commercial Hedgers) are positioned in the futures markets on a weekly basis.
Note that the respective 14-day relative strength indexes for the S&P 500 and the Nasdaq 100 have yet to hit the 30 threshold, a level which denotes oversold conditions. That suggests that US stocks could yet see more declines over the near-term.
Investors are coming to terms with the idea that the next round of US fiscal stimulus won’t arrive before the US elections, despite the repeated stresses by Fed officials that more government financial support is needed in order to sustain the still-nascent economic recovery. The spectre of drawn-out political uncertainty even after the November 3rd elections is also casting a huge dark cloud over market sentiment.
Yet judging by some indicators, some market participants don’t seem too particularly alarmed. The VIX index, which is widely seen as Wall Street’s fear gauge, has actually moderated since making a run towards the 40 level earlier this month. The VIX now reads below 30, and is testing its 200-day simple moving average, which is also serving as its immediate resistance line. The CBOE’s put options to call options ratio is still around half compared to levels seen during the market crash in March.
Equity bulls and bear are expected to continue duking it out in dictating how much longer the current selloff will persist. Although the longer-term investor will be heartened by the Fed’s lower-for-longer rates mantra, which should be supportive for stocks for years to come, perhaps they’ll just have to weather these near-term bumps along the way. At the time of writing, the FXTM trader sentiment remains net long on both the SP500m as well as the ND100m.
Disclaimer: The content in this article comprises personal opinions and should not be construed as containing personal and/or other investment advice and/or an offer of and/or solicitation for any transactions in financial instruments and/or a guarantee and/or prediction of future performance. ForexTime (FXTM), its affiliates, agents, directors, officers or employees do not guarantee the accuracy, validity, timeliness or completeness, of any information or data made available and assume no liability as to any loss arising from any investment based on the same.
![]() Article by ForexTime
Article by ForexTime
ForexTime Ltd (FXTM) is an award winning international online forex broker regulated by CySEC 185/12 www.forextime.com

- TSLA shares rose on a weak report. Inflationary pressures are easing in Australia Apr 24, 2024
- USDJPY: On intervention watch Apr 24, 2024
- Euro gains against the dollar amid mixed economic signals Apr 24, 2024
- PMI data is the focus of investors’ attention today. Turkey, Iraq, Qatar, and UAE signed a transportation agreement Apr 23, 2024
- Australian dollar rises on strong economic indicators Apr 23, 2024
- Geopolitical risks in the Middle East are declining. China kept interest rates at lows Apr 22, 2024
- Brent crude dips to four-week low amid easing geopolitical tensions Apr 22, 2024
- COT Metals Charts: Speculator bets led by Copper & Silver Apr 20, 2024
- COT Bonds Charts: Speculator bets led by 10-Year Bonds & Fed Funds Apr 20, 2024
- COT Stock Market Charts: Speculator bets led by S&P500-Mini Apr 20, 2024