
Article By RoboForex.com
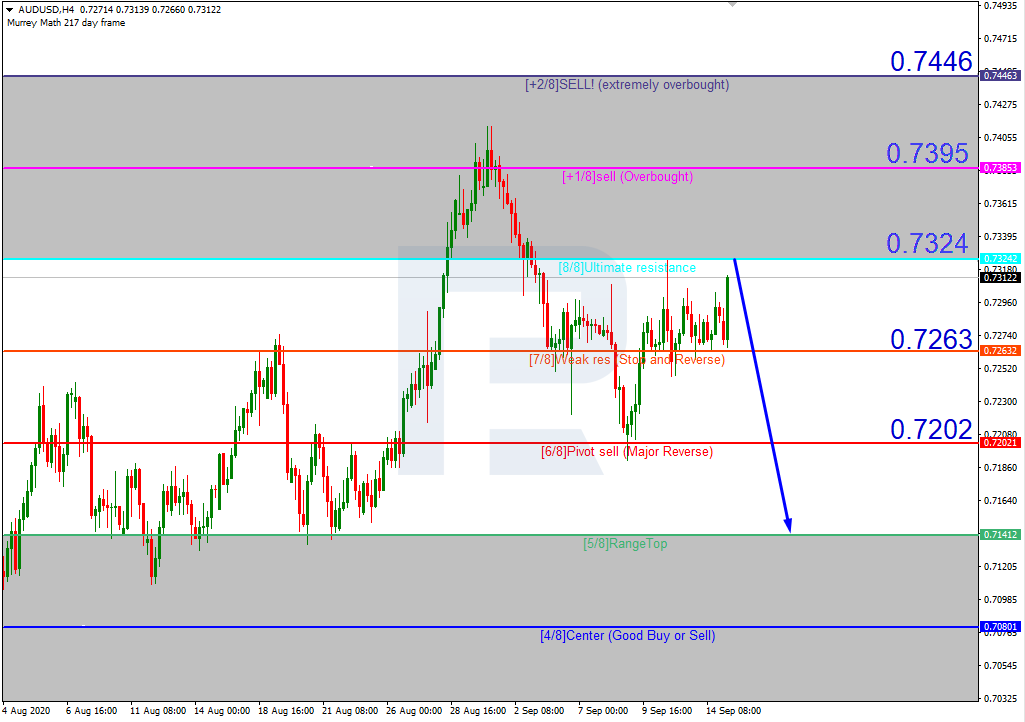
AUDUSD, “Australian Dollar vs US Dollar”
As we can see in the H4 chart, AUDUSD is moving not far from the “overbought area”. In this case, the pair is expected to rebound from 8/8 and resume falling to reach the support at 5/8. However, this scenario may be canceled if the price breaks 8/8 to the upside. After that, the instrument may continue growing towards the resistance at +1/8.

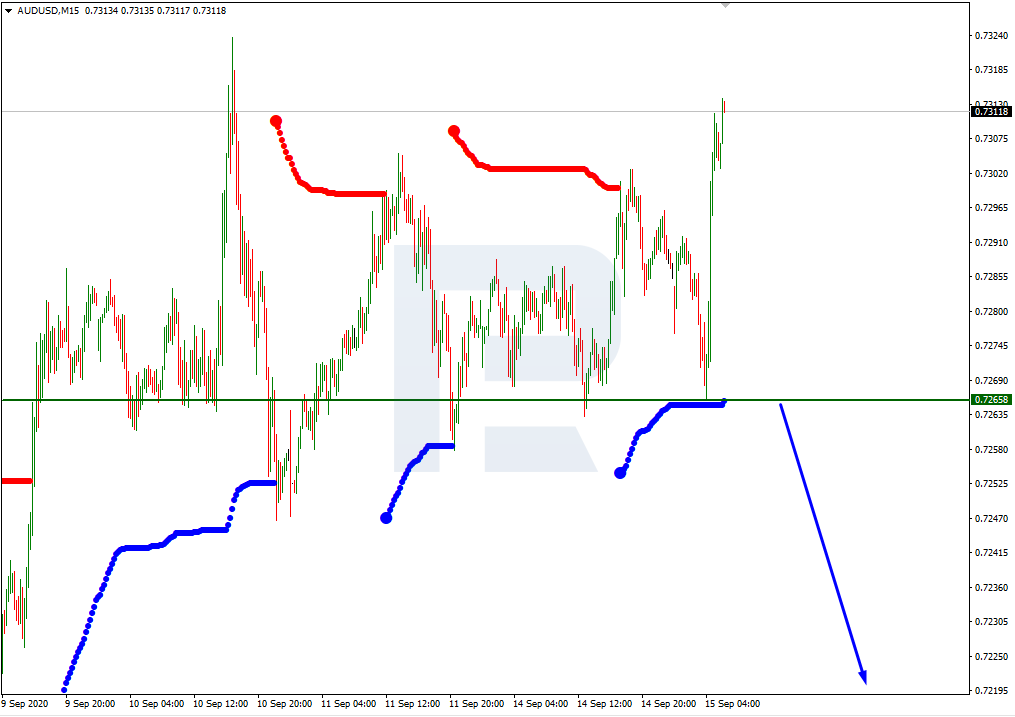
In the M15 chart, the pair may break the downside line of the VoltyChannel indicator and, as a result, continue trading downwards.
Free Reports:
 Download Our Metatrader 4 Indicators – Put Our Free MetaTrader 4 Custom Indicators on your charts when you join our Weekly Newsletter
 Get our Weekly Commitment of Traders Reports - See where the biggest traders (Hedge Funds and Commercial Hedgers) are positioned in the futures markets on a weekly basis.
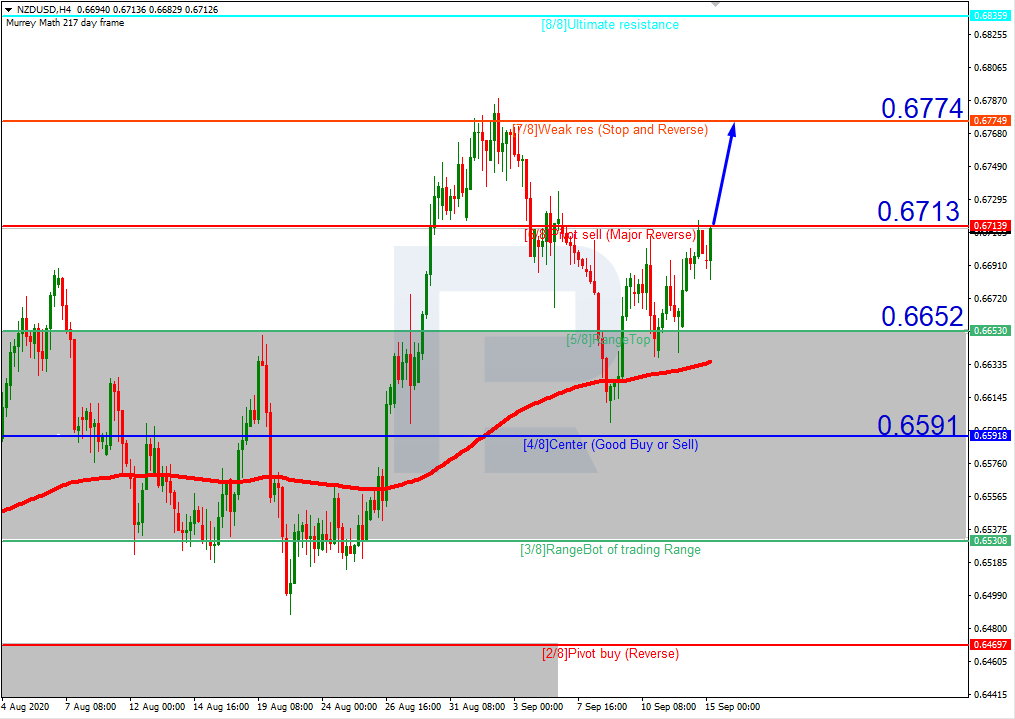
NZDUSD, “New Zealand Dollar vs US Dollar”
In the H4 chart, after rebounding from 5/8, NZDUSD is expected to continue trading upwards to reach the resistance at 7/8. However, this scenario may no longer be valid if the price breaks 5/8 to the downside. After that, the instrument may continue falling towards the support at 4/8.
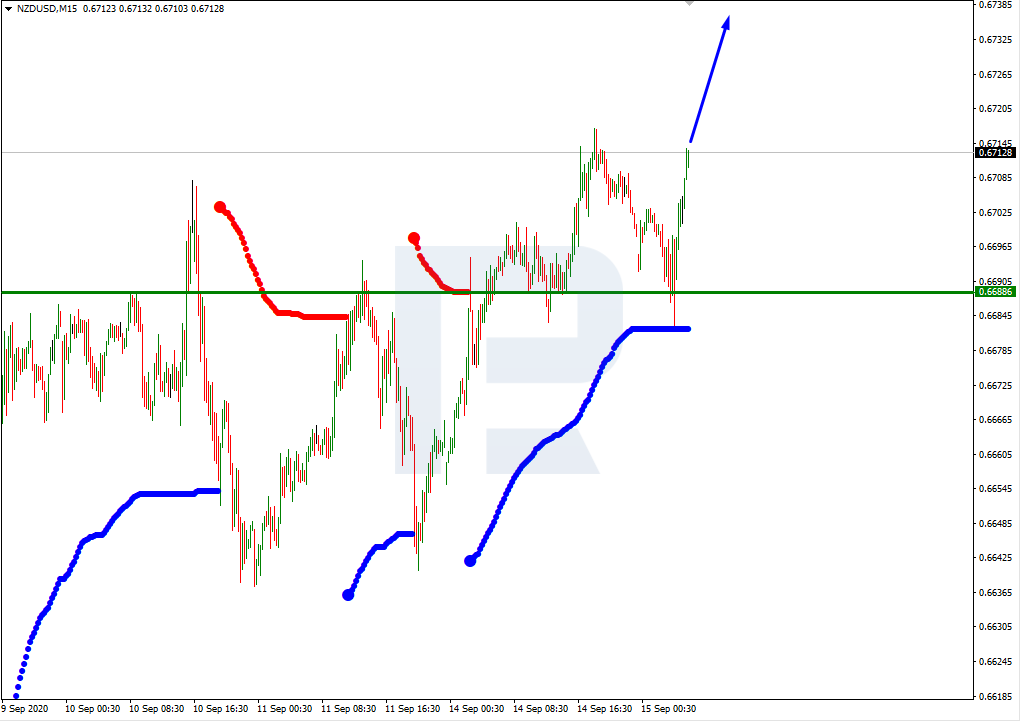
As we can see in the M15 chart, the pair has broken the upside line of the VoltyChannel indicator and, as a result, may continue moving upwards to reach 7/8 from the H4 chart.
Article By RoboForex.com
Attention!
Forecasts presented in this section only reflect the author’s private opinion and should not be considered as guidance for trading. RoboForex LP bears no responsibility for trading results based on trading recommendations described in these analytical reviews.

- The US natural gas prices fell to a 2-month low. A drop in the technology sector on Wednesday had a negative impact on the broad market Apr 18, 2024
- Target Thursdays: Cocoa, Bitcoin and USDCHF hit targets! Apr 18, 2024
- British Pound shows signs of recovery amid favourable inflation data Apr 18, 2024
- Indices decline amid hawkish comments from the Fed. Investors are waiting for Israel’s answer Apr 17, 2024
- EURGBP: Slams into support on hot UK inflation Apr 17, 2024
- Brent crude prices dip amid concerns over global demand Apr 17, 2024
- Stock indices sell-off amid rising geopolitical tensions in the Middle East. China’s GDP grew the most in a year Apr 16, 2024
- New FXTM commodity hits all-time high! Apr 16, 2024
- NZD hits five-month low against strong US dollar Apr 16, 2024
- Escalating conflict in the Middle East is forcing investors to shift funds to safe assets Apr 15, 2024