
– RESEARCH HIGHLIGHTS:
- The Transportation Index, has been unusually aligned with the S&P 500 over the past 8+ months.
- Classic Japanese Candlestick top/sell reversal “Three Rivers Evening Star topping pattern” setting up.
- We may see a much bigger downside price move where price attempts to find support near 9,800 or 9,200.
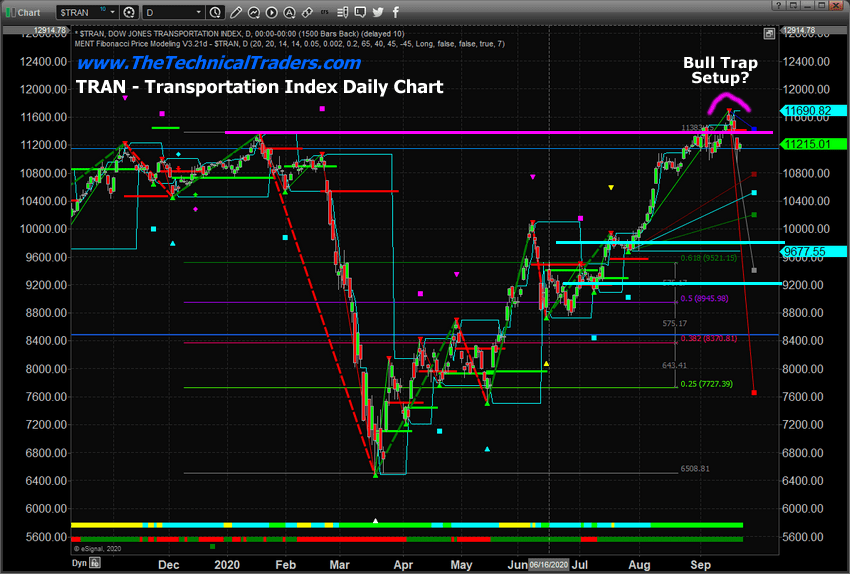
The Transportation Index, which typically leads the US stock market by 2 to 4+months, has been unusually aligned with the S&P 500 over the past 8+ months. Recently, though, the Transportation Index has rallied up to recent new all-time highs (over the past 9+ months) and has rotated lower – below resistance near 11,440 (the MAGENTA LINE on the first chart). Our researchers are warning us that any continued breakdown below this level could prompt a bigger downside market move.
IS RECENT ROTATION A TOPPING PATTERN OR JUST CONSOLIDATION?
Currently, the US stock market has rolled into a sideways/topping pattern. After the peak in metals setup near August 7, 2020, the US stock market continued to rally a bit higher, then rotated lower on September 3, 2020. The Transportation Index rolled over on September 3 but climbed higher less than 5 trading days later – breaking above the highs set before the COVID-19 peak.
We’ve suggested a “Bull Trap” pattern may be forming in the major markets and we’ve urged traders to cautious regarding the new price highs and appearance of a continued upside price rally. The Bull Trap pattern, sometimes called a “Scouting Party”, happens when price breaks above resistance (or below support) briefly in an attempt to establish a new trend. If price fails to find support after breaking above the previous resistance level, then it typically rotates lower and collapses back below the resistance level (attempting to find a lower support level).
If our research is correct, the recent rotation in the Transportation Index may suggest a Bull Trap pattern has setup and completed (with price falling back below the 11,440 level). If this trend continues, we may see a much bigger downside price move where price attempts to find support near 9,800 or 9,200.
Free Reports:
 Sign Up for Our Stock Market Newsletter – Get updated on News, Charts & Rankings of Public Companies when you join our Stocks Newsletter
 Get our Weekly Commitment of Traders Reports - See where the biggest traders (Hedge Funds and Commercial Hedgers) are positioned in the futures markets on a weekly basis.
This Daily Transportation Index chart highlights our proprietary Fibonacci Price Modeling system and the key resistance level near 11,440 (in MAGENTA). It also shows the Bull Trap setup near the recent highs. Past Fibonacci Price Trigger levels near 9,800 and 9,200 suggest any downside price move may target these levels as current support.
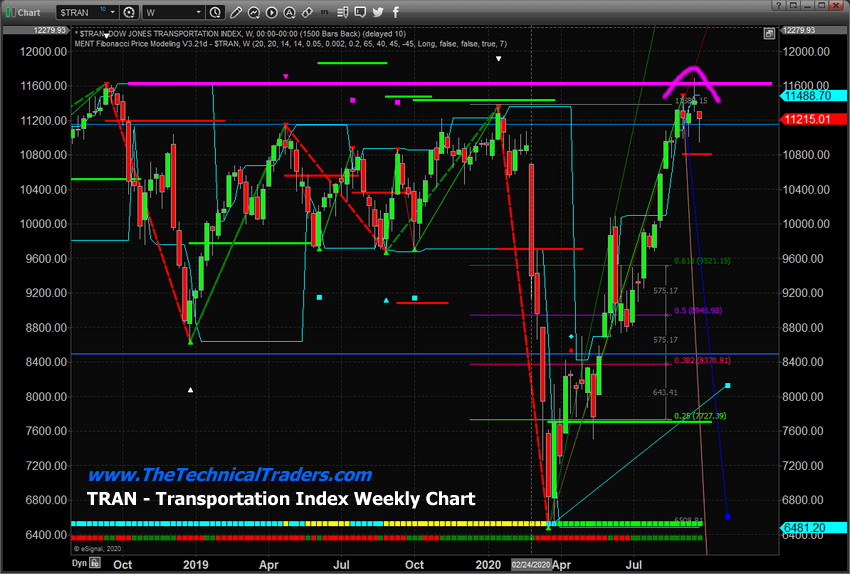
This Transportation Index Weekly chart provides a bigger picture look at the Bull Trap setup. The one aspect of the Weekly Transportation chart that we feel is critical is the 10,815 Bearish Price Trigger level from our Fibonacci Price Modeling System. This level is key to understanding if and when the Transportation Index breaks a major weekly Fibonacci trigger level. If price falls below the 10,815 level and manages to close below this level on an end-of-week basis, then we have confirmation that the longer term Fibonacci trigger level has confirmed a new bearish price trend. Right now, we don’t have that confirmation.
Be sure to sign up for our free market trend analysis and signals now so you don’t miss our next special report!
One other interesting pattern that has set up on the Weekly Transportation Index is the Three Rivers Evening Star topping pattern. This is a classic Japanese Candlestick top/sell reversal pattern. The term “three rivers” references the confluence of two rivers joining together (think of the strength and force of the water flow) to form a new “third river”. The descriptive name of the pattern is designed to illustrate the nuanced strength that lies behind this price setup. A three rivers pattern, once confirmed, is one of the more ominous topping patterns in Japanese Candlestick price theory. It is usually associated with Doji and Hammer/Umbrella shaped price bars that are equally indicative of a price reversal.
In our past research, we authored a research article about Dow Theory and price trends that we believe should be reviewed by our friends and followers. It clearly describes the “Down Price Trend” theory and our research team’s believe that recent weakness in the US stock market may prompt a new downside price trend.
At this time, we continue to urge our friends and followers to stay cautious of volatility and price rotation. The markets are in the process of rotating – certainly. The issue for all skilled technical traders right now is “will it find support or will it break down and start a new downside price trend?”. Our researchers believe we know what will happen next, we are just waiting for technical confirmation from price activity.
Visit TheTechnicalTraders.com to learn how we can help you find and execute better trades and avoid risk. If you follow our research, you already know we have stayed well ahead of these trends and big price rotations in the US stock market. What’s next is even more big trends and profits for those able to engage in the best trade setups.
As a technical analyst and trader since 1997, I have been through a few bull/bear market cycles in stocks and commodities. I believe I have a good pulse on the market and timing key turning points for investing and short-term swing traders. Subscribers of my Active ETF Swing Trading Newsletter can ride my coattails as I navigate these financial markets and build wealth. My research and trading team are here to help you find better trades and navigate these incredibly crazy market trends.
While most of us have active trading accounts, our long-term investment and retirement accounts are equally at risk. We can also help you preserve and even grow your long term capital when things get ugly (likely now) with our Passive Long-Term ETF Investing Signals. Don’t wait until it is too late – subscribe today!
Have a great weekend and stay safe and healthy!
Chris Vermeulen
Chief Market Strategies
Founder of Technical Traders Ltd.
NOTICE AND DISCLAIMER: Our free research does not constitute a trade recommendation or solicitation for our readers to take any action regarding this research. It is provided for educational purposes only – read our FULL DISCLAIMER here. Visit TheTechnicalTraders.com to learn how to take advantage of our members-only research and trading signals.

- PMI data is the focus of investors’ attention today. Turkey, Iraq, Qatar, and UAE signed a transportation agreement Apr 23, 2024
- Australian dollar rises on strong economic indicators Apr 23, 2024
- Geopolitical risks in the Middle East are declining. China kept interest rates at lows Apr 22, 2024
- Brent crude dips to four-week low amid easing geopolitical tensions Apr 22, 2024
- COT Metals Charts: Speculator bets led by Copper & Silver Apr 20, 2024
- COT Bonds Charts: Speculator bets led by 10-Year Bonds & Fed Funds Apr 20, 2024
- COT Stock Market Charts: Speculator bets led by S&P500-Mini Apr 20, 2024
- COT Soft Commodities Charts: Speculator bets led by Soybean Meal & Lean Hogs Apr 20, 2024
- 3 Signs of Developing U.S. Economic Slowdown Apr 19, 2024
- Israel has retaliated against Iran. Investors run to safe assets Apr 19, 2024