
Article By RoboForex.com
EURUSD, “Euro vs US Dollar”
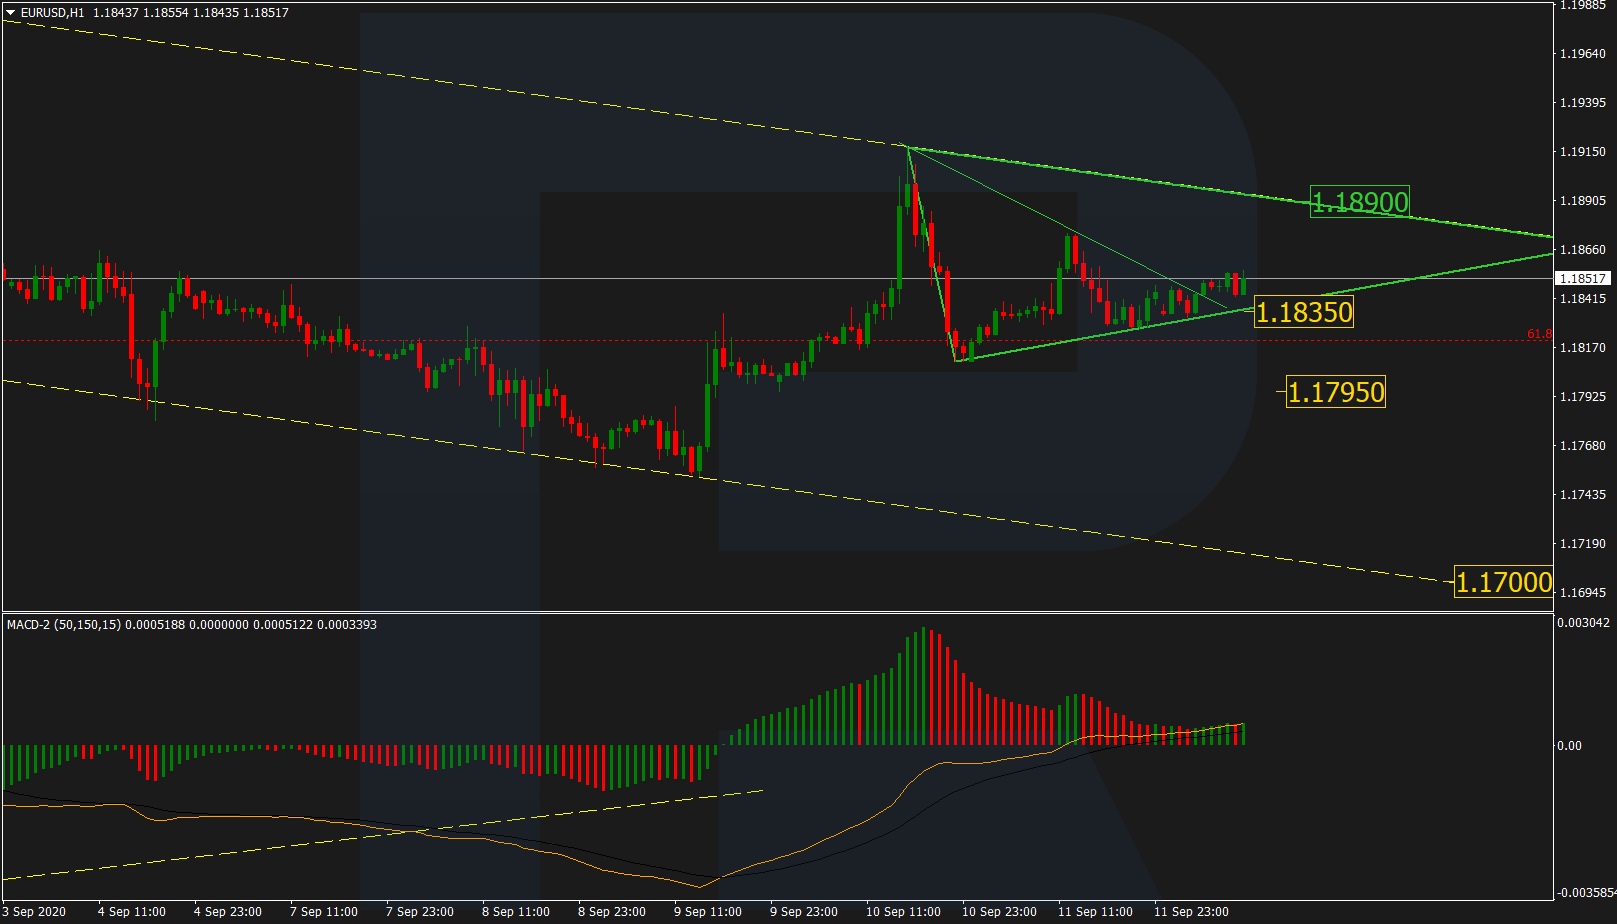
EURUSD is consolidating within a Triangle pattern. After testing the pattern’s downside border, the pair may grow to test the key resistance line of the descending channel at 1.1890. This scenario is confirmed by the MACD indicator, which is directed to the upside. However, considering that the major trend is bearish, one shouldn’t exclude the possibility of a breakout of the support level at 1.1835. In this case, the price may reach 1.1795 and fix below it. Later, the market may continue the downtrend towards 1.17.

GBPUSD, “Great Britain Pound vs US Dollar”
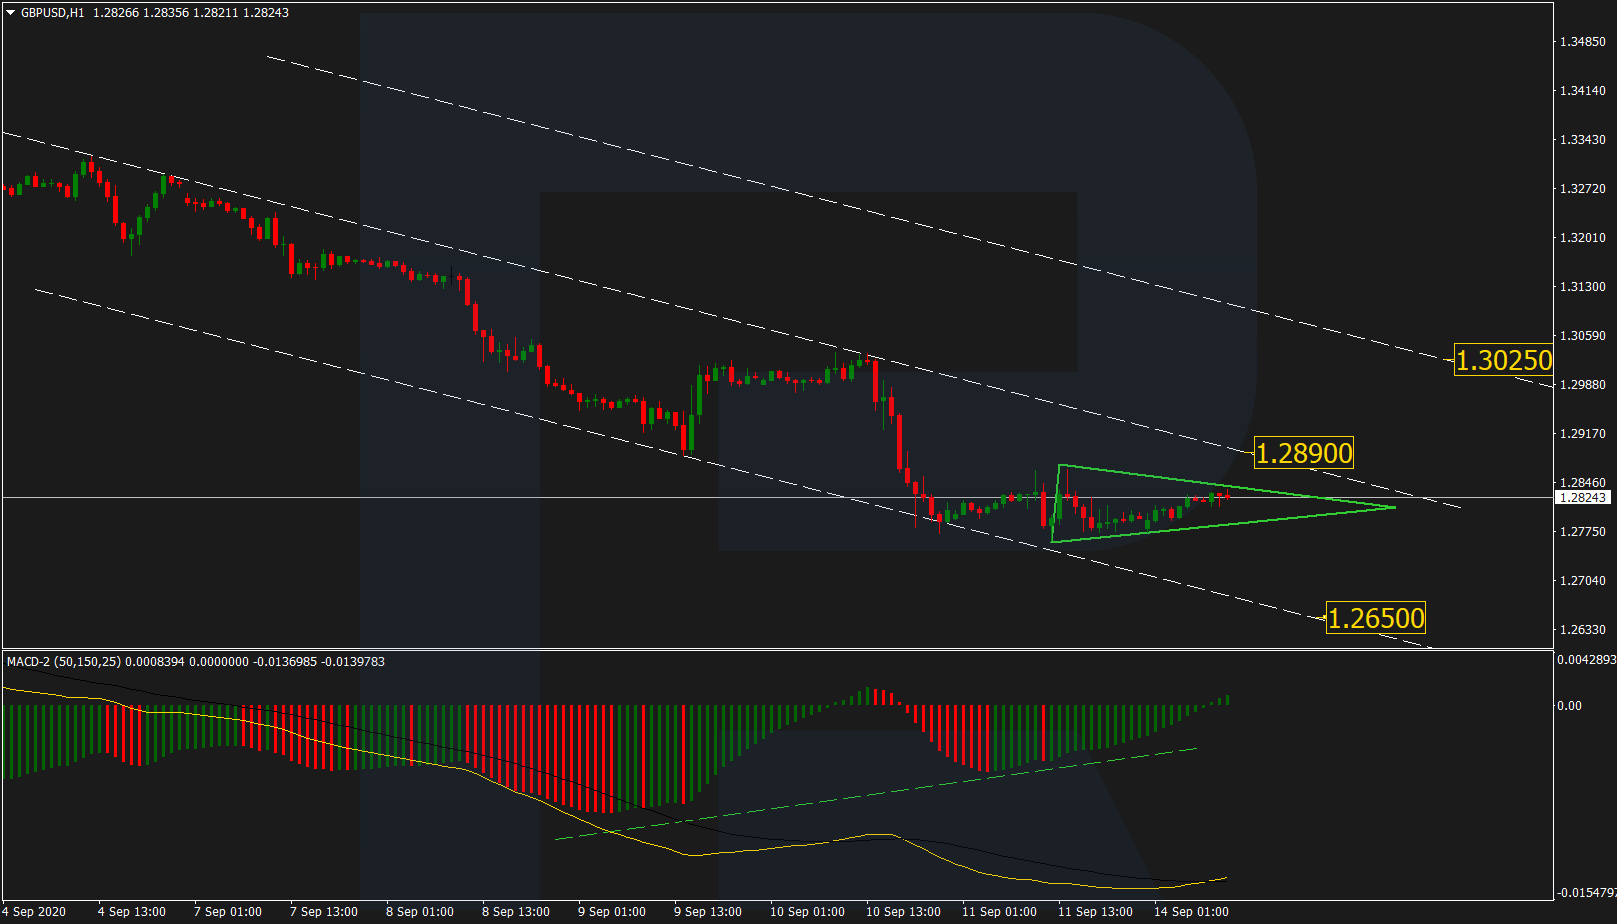
GBPUSD is still falling. After updating the short-term low and the convergence on MACD, the pair is forming a local correction in the form of a Triangle. In this case, both scenarios are possible – the price may break the pattern either to the upside or downside. In the former case, the instrument may test the resistance line at 1.2890 and then continue growing with the target at 1.3025. Otherwise, the market may continue trading downwards to reach 1.2650.
Free Reports:
 Sign Up for Our Stock Market Newsletter – Get updated on News, Charts & Rankings of Public Companies when you join our Stocks Newsletter
 Get our Weekly Commitment of Traders Reports - See where the biggest traders (Hedge Funds and Commercial Hedgers) are positioned in the futures markets on a weekly basis.
USDRUB, “US Dollar vs Russian Ruble”
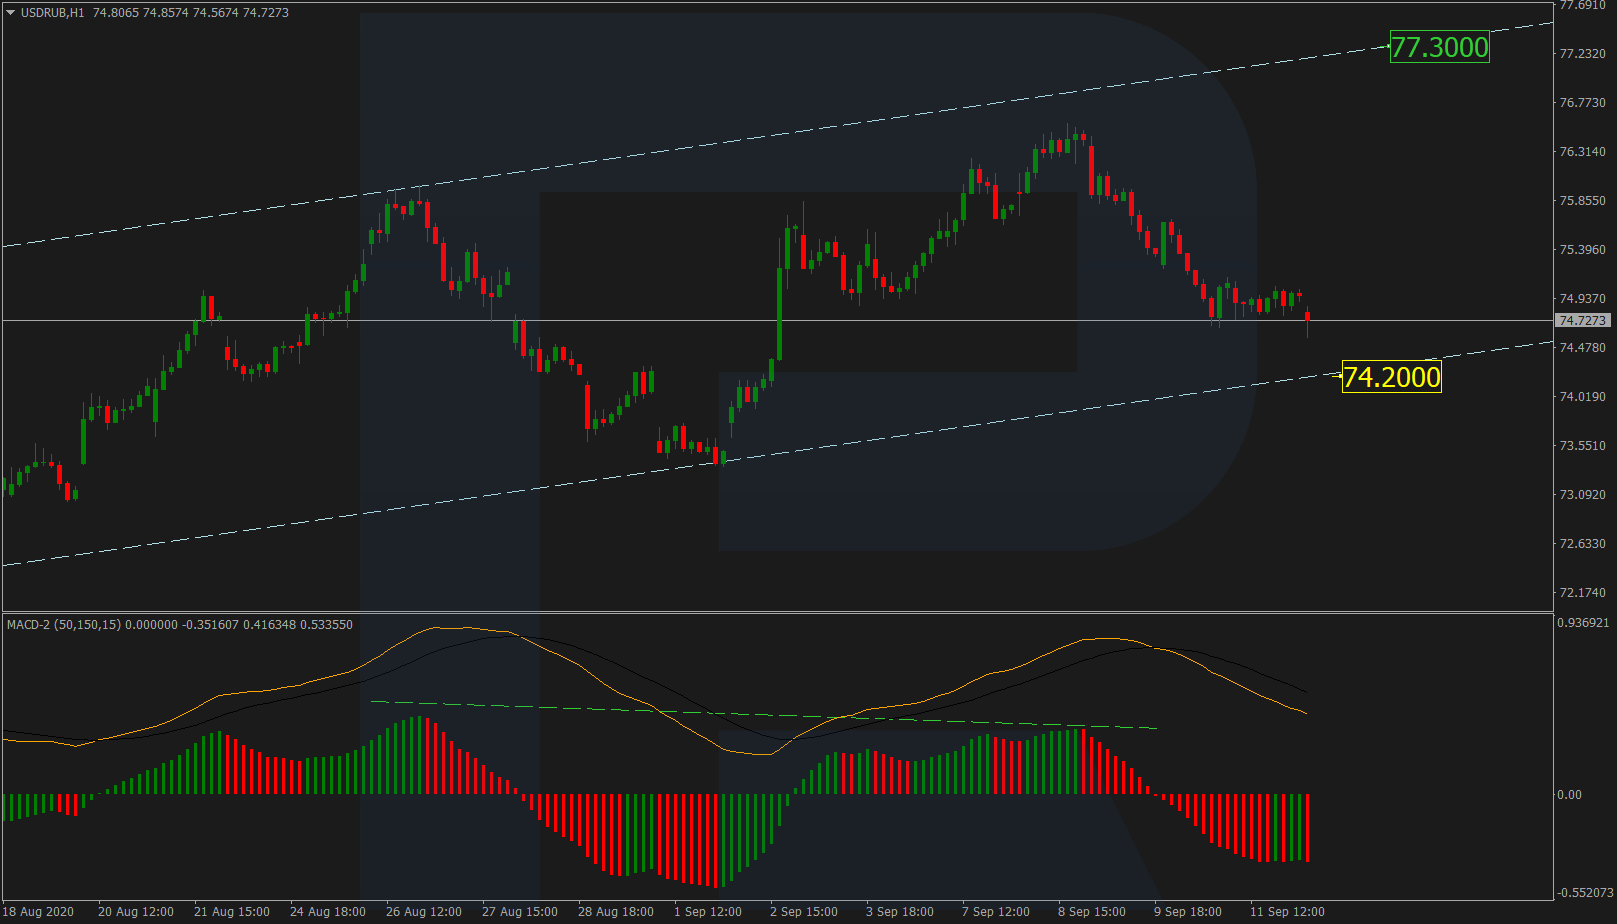
After completing a quick descending wave, USDRUB is consolidating. In the nearest future, the pair may fall towards the key support level at 74.20. This scenario is confirmed by the MACD indicator, which is directed to the downside. After testing the level, the instrument may rebound and form a new ascending wave to reach the resistance line at 77.30.
USDJPY, “US Dollar vs Japanese Yen”
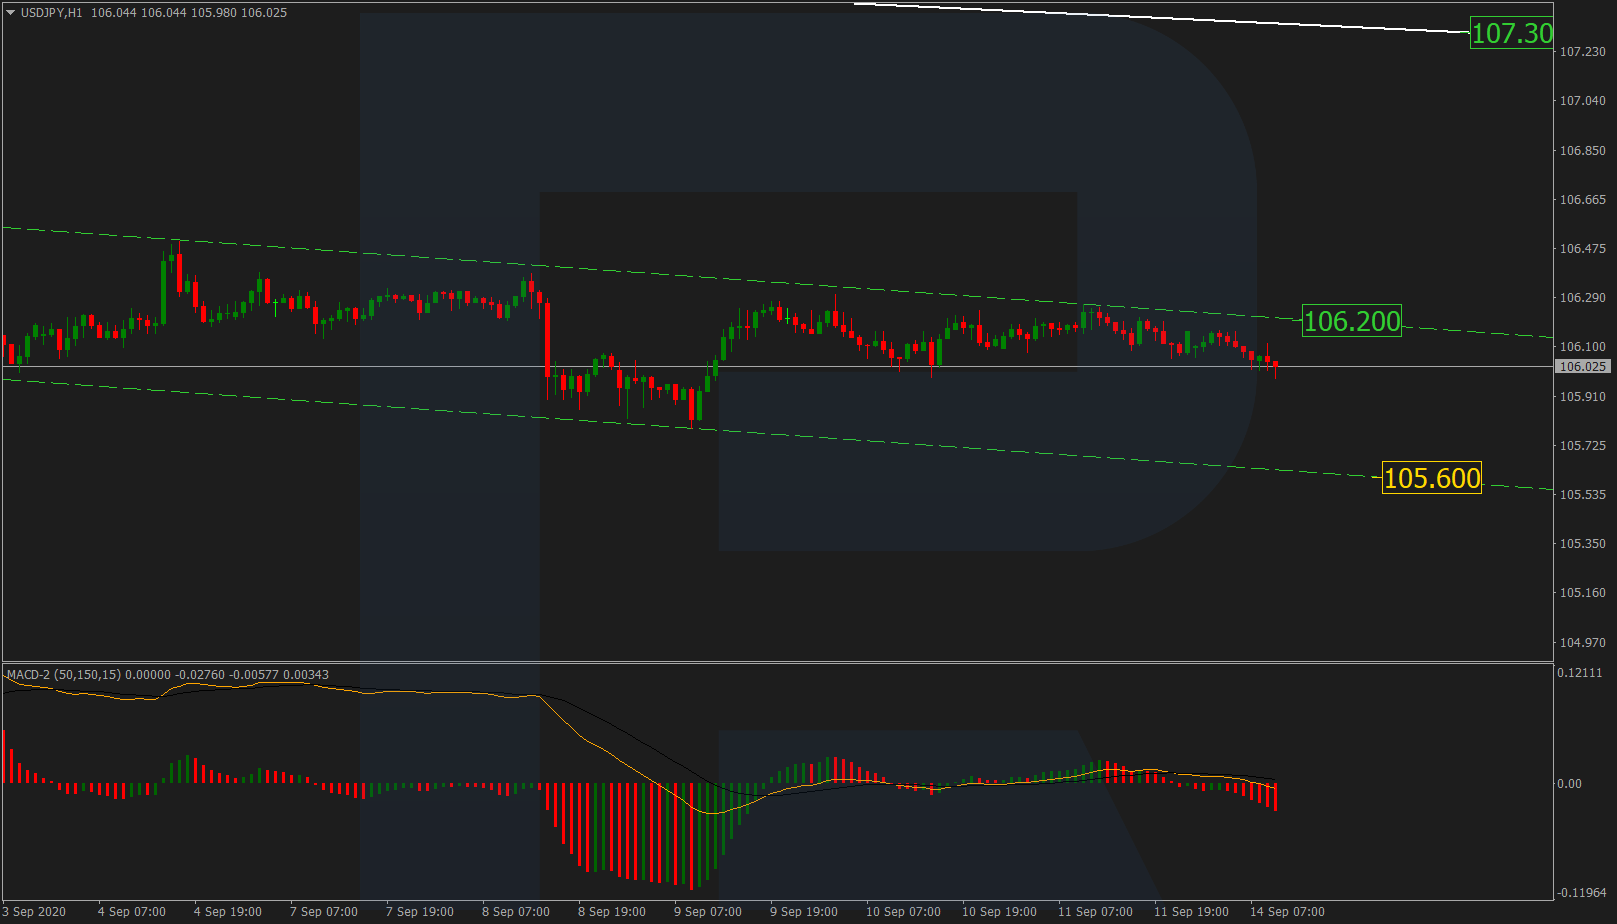
After rebounding from the descending channel’s upside border, USDJPY is moving towards the support line at 105.60. This scenario is confirmed by the MACD indicator, which is also directed to the downside. However, there might be an alternative scenario that implies a possible breakout of the resistance line at 106.20 and further growth to reach the key resistance line at 107.30.
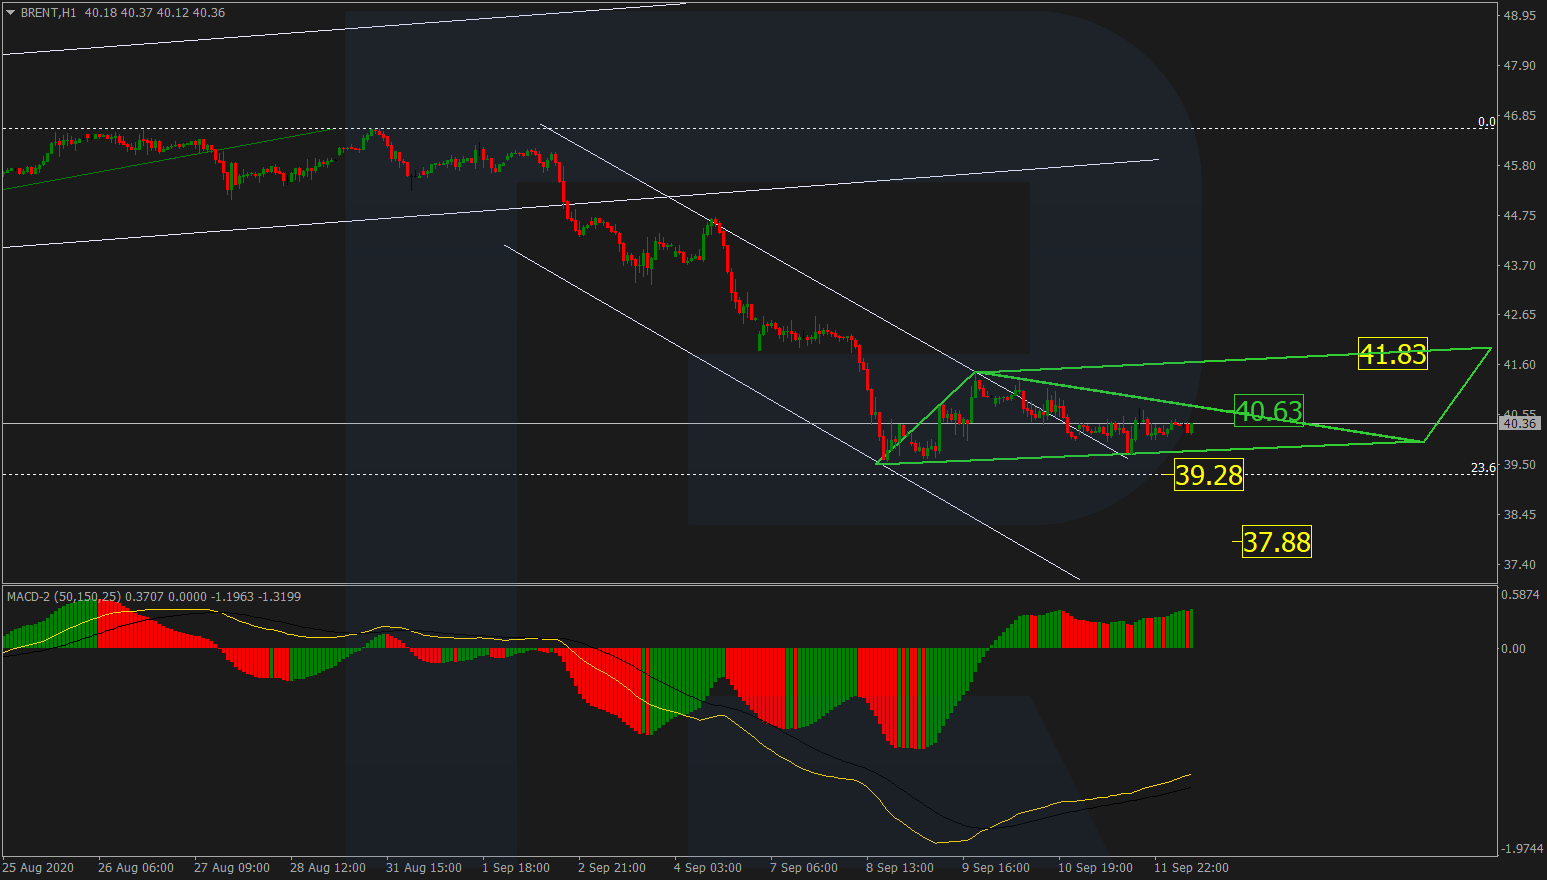
BRENT
Brent is correcting within a Triangle pattern. However, judging by the MACD indicator, which is directed to the upside, the price is expected to break the resistance line at 40.63 and then expand the correctional channel up to 41.83. Still, if the pair breaks the support line at 39.70, the market may fall to break 23.6% fibo (39.28) and then reach 37.88.
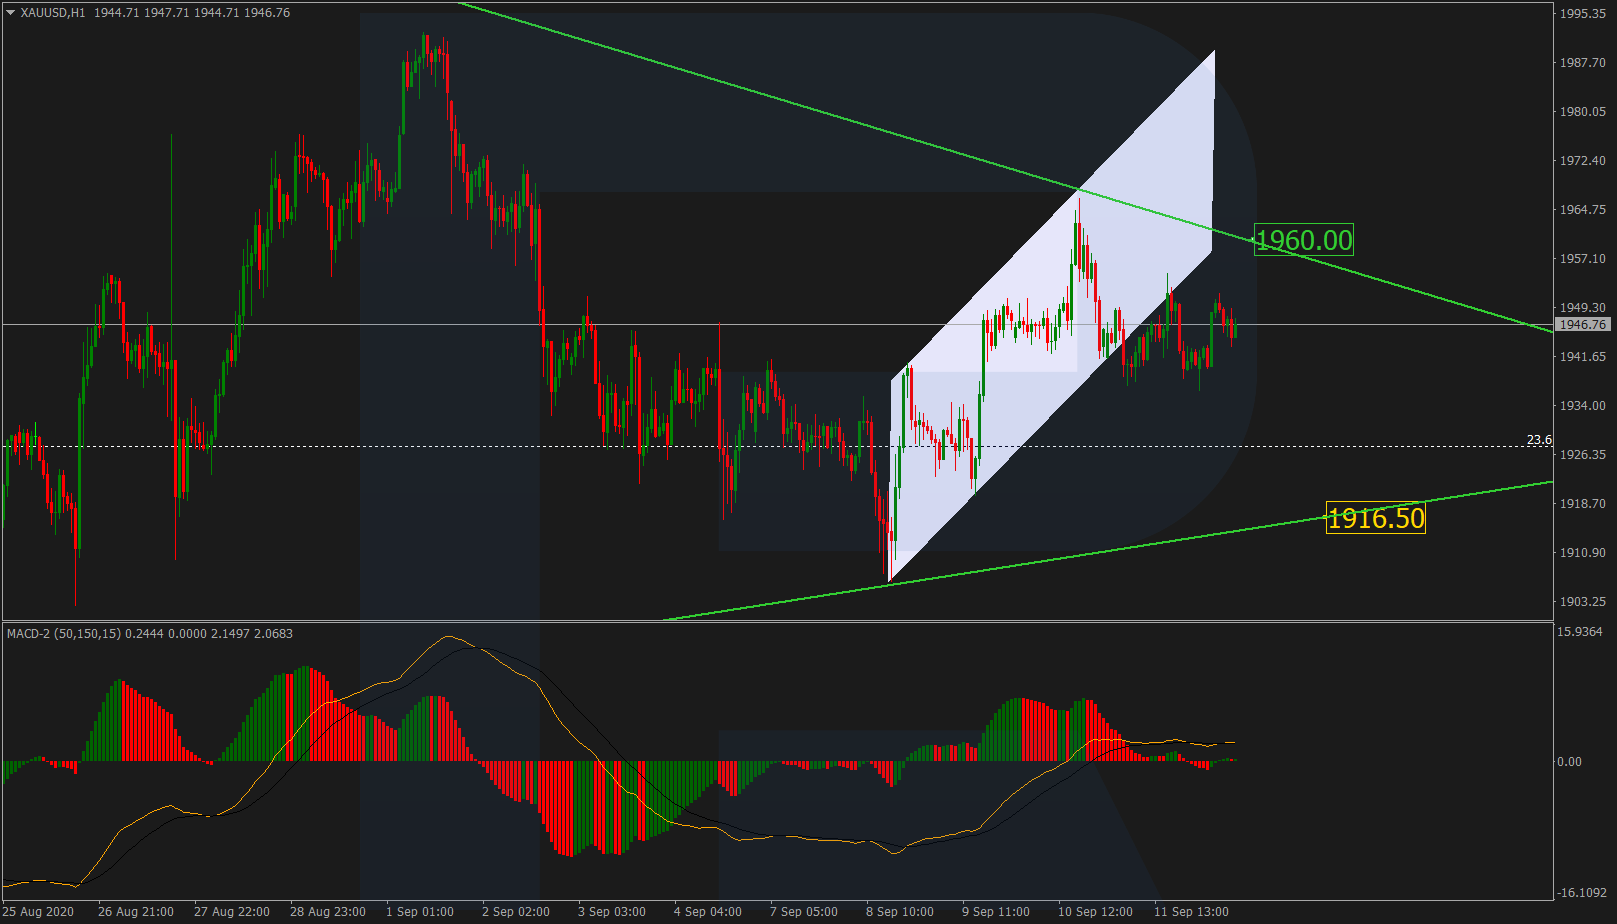
XAUUSD, “Gold vs US Dollar”
Gold is forming a mid-term triangle channel. After breaking the downside border of the previous ascending channel, the pair is moving sideways, which may be a signal for a short-term growth towards the resistance line at 1960.00. However, the key trend remains bearish, that’s why the instrument is expected to continue trading downwards with the target at 1916.50.
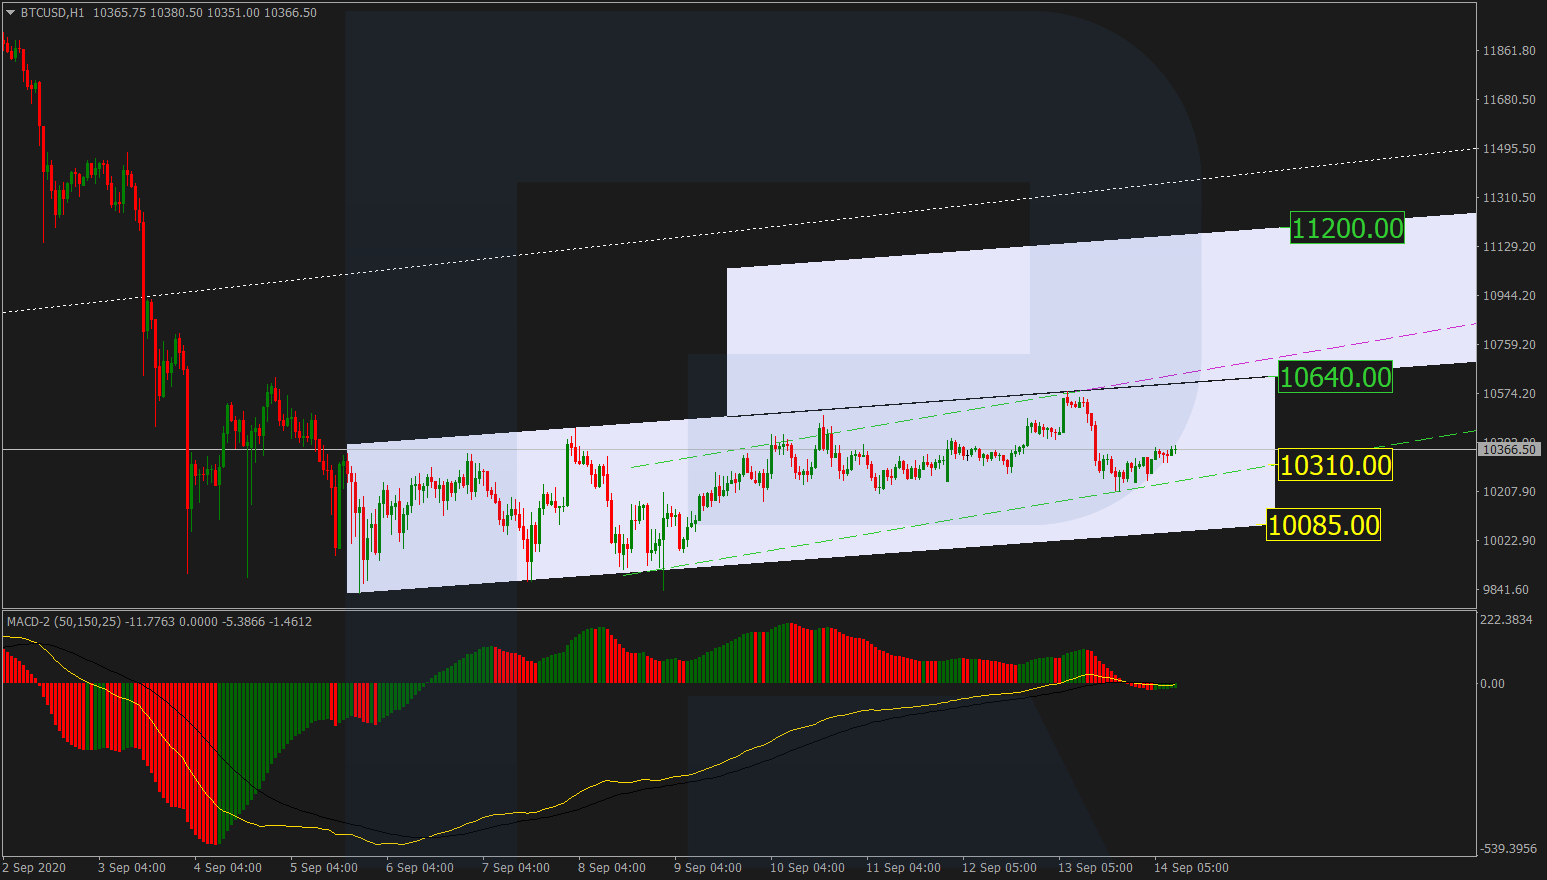
BTCUSD, “Bitcoin vs US Dollar”
After rebounding from the support line and transforming a correctional channel into an ascending one, BTCUSD is growing towards the key resistance line at 10640.00. Later, the market may break it and continue trading upwards to reach 11200.00. However, if the price fails to break the above-mentioned resistance level and rebounds from it, the market may start a new descending structure towards the key support line at 10085.00.
Article By RoboForex.com
Attention!
Forecasts presented in this section only reflect the author’s private opinion and should not be considered as guidance for trading. RoboForex LP bears no responsibility for trading results based on trading recommendations described in these analytical reviews.

- Israel has retaliated against Iran. Investors run to safe assets Apr 19, 2024
- Gold hits record high amid growing geopolitical tensions Apr 19, 2024
- The US natural gas prices fell to a 2-month low. A drop in the technology sector on Wednesday had a negative impact on the broad market Apr 18, 2024
- Target Thursdays: Cocoa, Bitcoin and USDCHF hit targets! Apr 18, 2024
- British Pound shows signs of recovery amid favourable inflation data Apr 18, 2024
- Indices decline amid hawkish comments from the Fed. Investors are waiting for Israel’s answer Apr 17, 2024
- EURGBP: Slams into support on hot UK inflation Apr 17, 2024
- Brent crude prices dip amid concerns over global demand Apr 17, 2024
- Stock indices sell-off amid rising geopolitical tensions in the Middle East. China’s GDP grew the most in a year Apr 16, 2024
- New FXTM commodity hits all-time high! Apr 16, 2024