

Source: Economic Events September 04, 2020 – Admiral Markets’ Forex Calendar
On Tuesday, EURUSD spiked to the psychologically relevant mark of 1.2000, trading at its highest levels since May 2018.
But instead of taking on further momentum, the Euro saw heavier selling afterwards which accelerated after ECB chief economist Lane said later that day that the […]ECB doesn’t target the FX rate, but that the Euro-Dollar rate matters[…]
While the timing of this rhetoric, coming after the short spike to 1.2000 the same day, may have been a coincidence, market participants may have wondered how strong the ECB will let the Euro become before rhetorically intervening, especially against the US-Dollar. It is kind of ‘special’ in the current market environment.
Free Reports:
 Sign Up for Our Stock Market Newsletter – Get updated on News, Charts & Rankings of Public Companies when you join our Stocks Newsletter
 Get our Weekly Commitment of Traders Reports - See where the biggest traders (Hedge Funds and Commercial Hedgers) are positioned in the futures markets on a weekly basis.
“Special” because of the potential extreme sentiment which can be seen in the quite extreme net long position in the Commitment of Traders Report among large speculators, which could result in a sharper bounce short-term.
While we consider the mode neutral as long as EURUSD trades above 1.1700, here are a few key points to consider
- At least a test of the region around 1.1700 in the days to come seems likely
- Testing 1.1700 seems especially likely if today’s Non-Farm Payrolls continue to print similarly strong as in the months since the corona lockdown in March/April if US unemployment rates continue to drop
- Technically, further pressure on the downside could result out of the bearish divergence on D1 in the RSI(14).
Still, holding above 1.1700 in addition to the FED’s “average inflation targeting” paints a bullish picture for EURUSD and we expect in the upcoming 6 to 12 months a deeper run above 1.2000:
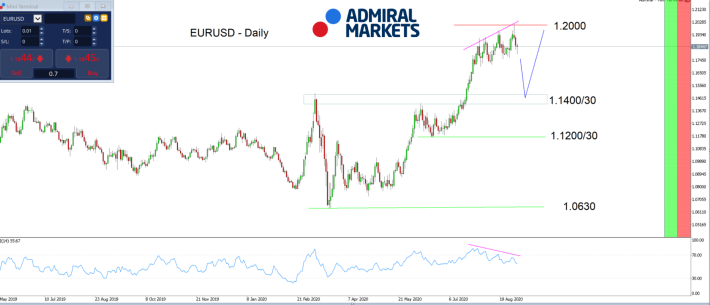
Source: Admiral Markets MT5 with MT5SE Add-on EURUSD Daily chart (between May 27, 2019, to September 03, 2020). Accessed: September 03, 2020, at 10:00 PM GMT – Please note: Past performance is not a reliable indicator of future results, or future performance.
In 2015, the value of the EUR/USD fell by 10.2%. In 2016, it fell by 3.2%. In 2017, it increased by 13.92%. In 2018, it dropped 4.4% and in 2019, it fell by 2.2%, meaning that after five years, it was down by 7.3%.
Discover the world’s #1 multi-asset platform
Admiral Markets offers professional traders the ability to trade with a custom, upgraded version of MetaTrader 5, allowing you to experience trading at a significantly higher, more rewarding level. Experience benefits such as the addition of the Market Heat Map, so you can compare various currency pairs to see which ones might be lucrative investments, access real-time trading data, and so much more. Click the banner below to start your FREE download of MT5 Supreme Edition!

Disclaimer: The given data provides additional information regarding all analysis, estimates, prognosis, forecasts or other similar assessments or information (hereinafter “Analysis”) published on the website of Admiral Markets. Before making any investment decisions please pay close attention to the following:
- This is a marketing communication. The analysis is published for informative purposes only and is in no way to be construed as investment advice or recommendation. It has not been prepared in accordance with legal requirements designed to promote the independence of investment research, and that it is not subject to any prohibition on dealing ahead of the dissemination of investment research.
- Any investment decision is made by each client alone whereas Admiral Markets shall not be responsible for any loss or damage arising from any such decision, whether or not based on the Analysis.
- Each of the Analysis is prepared by an independent analyst (Jens Klatt, Professional Trader and Analyst, hereinafter “Author”) based on the Author’s personal estimations.
- To ensure that the interests of the clients would be protected and objectivity of the Analysis would not be damaged Admiral Markets has established relevant internal procedures for prevention and management of conflicts of interest.
- Whilst every reasonable effort is taken to ensure that all sources of the Analysis are reliable and that all information is presented, as much as possible, in an understandable, timely, precise and complete manner, Admiral Markets does not guarantee the accuracy or completeness of any information contained within the Analysis. The presented figures that refer to any past performance is not a reliable indicator of future results.
- The contents of the Analysis should not be construed as an express or implied promise, guarantee or implication by Admiral Markets that the client shall profit from the strategies therein or that losses in connection therewith may or shall be limited.
- Any kind of previous or modelled performance of financial instruments indicated within the Publication should not be construed as an express or implied promise, guarantee or implication by Admiral Markets for any future performance. The value of the financial instrument may both increase and decrease and the preservation of the asset value is not guaranteed.
- The projections included in the Analysis may be subject to additional fees, taxes or other charges, depending on the subject of the Publication. The price list applicable to the services provided by Admiral Markets is publicly available from the website of Admiral Markets.
Leveraged products (including contracts for difference) are speculative in nature and may result in losses or profit. Before you start trading, you should make sure that you understand all the risks.

- The US natural gas prices fell to a 2-month low. A drop in the technology sector on Wednesday had a negative impact on the broad market Apr 18, 2024
- Target Thursdays: Cocoa, Bitcoin and USDCHF hit targets! Apr 18, 2024
- British Pound shows signs of recovery amid favourable inflation data Apr 18, 2024
- Indices decline amid hawkish comments from the Fed. Investors are waiting for Israel’s answer Apr 17, 2024
- EURGBP: Slams into support on hot UK inflation Apr 17, 2024
- Brent crude prices dip amid concerns over global demand Apr 17, 2024
- Stock indices sell-off amid rising geopolitical tensions in the Middle East. China’s GDP grew the most in a year Apr 16, 2024
- New FXTM commodity hits all-time high! Apr 16, 2024
- NZD hits five-month low against strong US dollar Apr 16, 2024
- Escalating conflict in the Middle East is forcing investors to shift funds to safe assets Apr 15, 2024