
Author: Dmitriy Gurkovskiy, Chief Analyst at RoboForex
On the final September Monday, the major currency pair is sticking to its two-month lows and trading around 1.1634.
The start of this week is anticipated to be calm for EUR/USD but there will be a lot of news later.
As usual, at the beginning of every month, the USA is going to report on its labor market and September readings may raise a lot of questions. The first of them is whether the positive impulse, which helped to eliminate the spring crisis with jobs and labor force, is still strong or on the decline and may start consolidating? If the employment indicators do not steadily improve, there will be talks about additional stimulus packages, which is a serious problem.
This week, the USA will publish the final report on the country’s GDP for the second quarter of 2020. If the actual readings are not worse than expected, the USD may find some support because all problems in this area have already been included in prices.
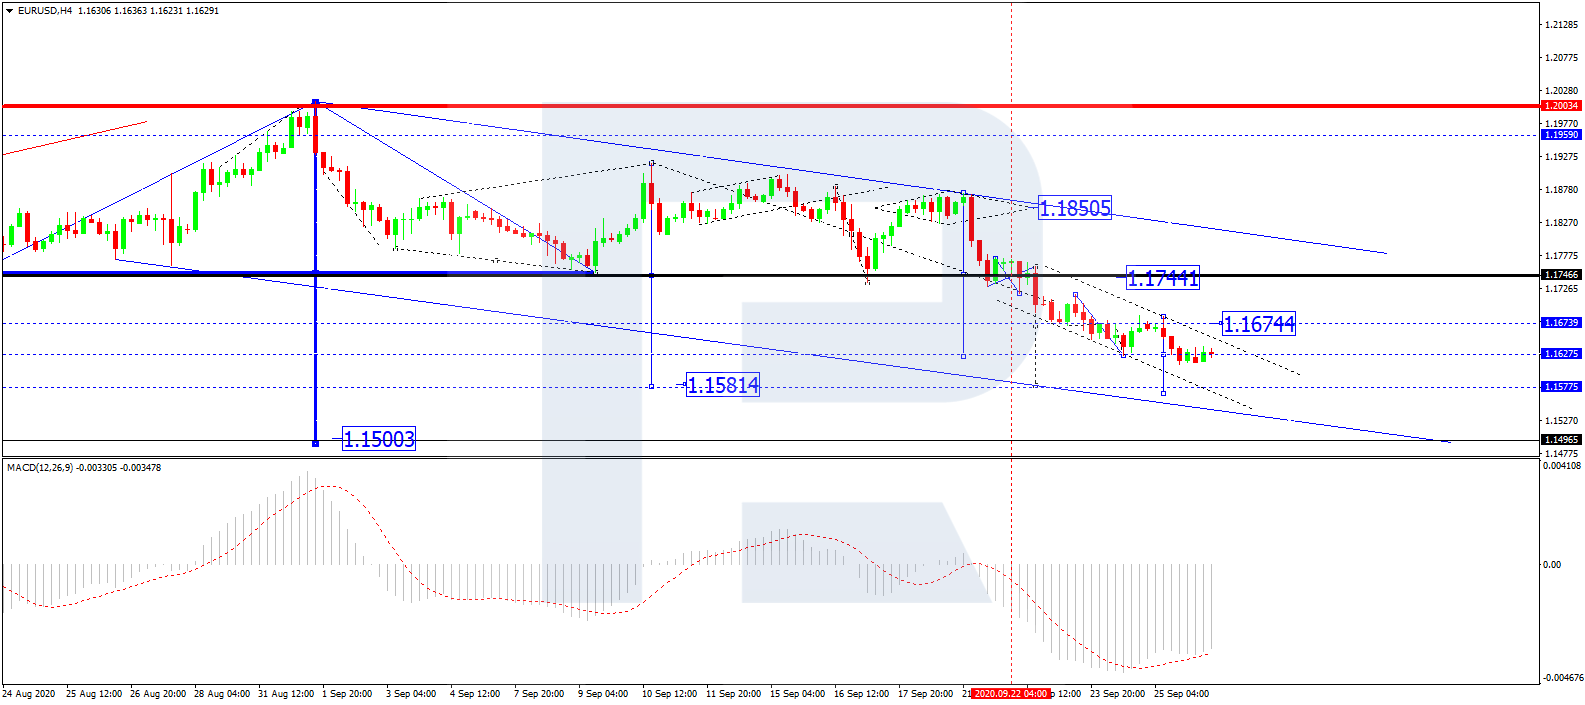
In the H4 chart, EUR/USD is forming the third descending wave with the target at 1.1600. Later, the market may correct towards 1.1744 and then continue trading inside the downtrend with the target at 1.1500. From the technical point of view, this scenario is confirmed by MACD Oscillator: its signal line is no longer moving inside the histogram area. However, taking into account that on the price chart the instrument may yet continue falling, the line is not expected to rise towards 0 until the price reaches the target. If later the line breaks 0, there might be a new correction on the price chart.
Free Reports:
 Download Our Metatrader 4 Indicators – Put Our Free MetaTrader 4 Custom Indicators on your charts when you join our Weekly Newsletter
 Get our Weekly Commitment of Traders Reports - See where the biggest traders (Hedge Funds and Commercial Hedgers) are positioned in the futures markets on a weekly basis.
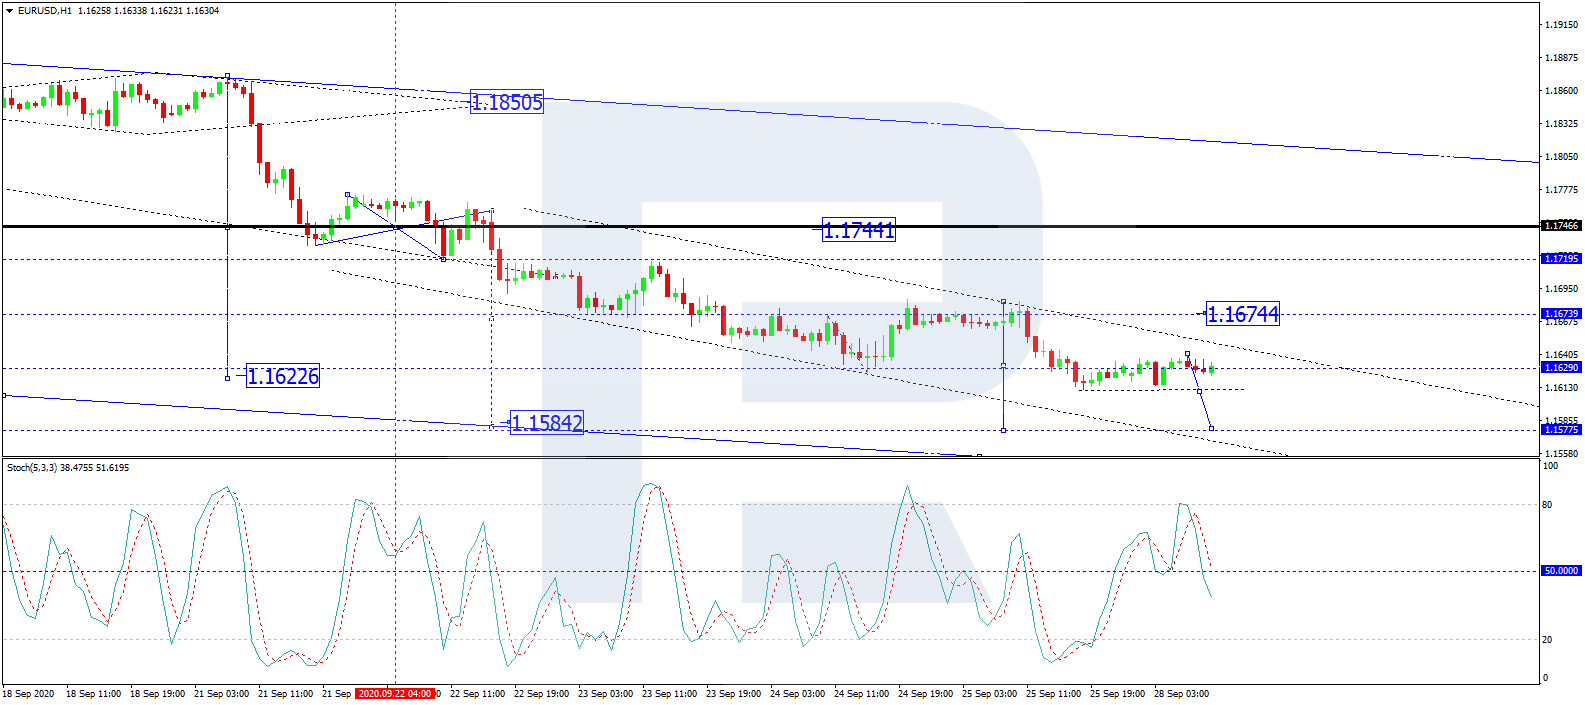
As we can see in the H1 chart, after breaking 1.1640, EUR/USD is consolidating below it. Possibly, the pair may test this level from below and then resume falling to break 1.1612. After that, the instrument may continue trading downwards to reach 1.1600 at least. From the technical point of view, this scenario is confirmed by Stochastic Oscillator: its signal line is moving downwards and has already broken 50. Later, it may continue falling to reach 20. Only after the line leaves the area of 20, the asset may start a correction on the price chart.
Disclaimer
Any forecasts contained herein are based on the author’s particular opinion. This analysis may not be treated as trading advice. RoboForex bears no responsibility for trading results based on trading recommendations and reviews contained herein.

- Escalating conflict in the Middle East is forcing investors to shift funds to safe assets Apr 15, 2024
- US dollar exhibits remarkable strength amid global tensions Apr 15, 2024
- COT Metals Charts: Speculator bets led higher by Copper & Platinum Apr 13, 2024
- COT Bonds Charts: Speculator Bets led by 10-Year & 5-Year Bonds Apr 13, 2024
- COT Soft Commodities Charts: Speculator Bets led by Soybean Meal & Lean Hogs Apr 13, 2024
- COT Stock Market Charts: Weekly Speculator Bets led by VIX & S&P500-Mini Apr 13, 2024
- Singapore’s central bank (MAS) maintained its monetary policy settings. The ECB hinted at a rate cut soon Apr 12, 2024
- Australian dollar struggles amid robust US economic data Apr 12, 2024
- The Bank of Canada maintained its monetary policy settings. The FOMC minutes showed that policymakers will not be in a hurry to cut rates Apr 11, 2024
- US Dollar strengthens following high inflation data Apr 11, 2024