
Author: Dmitriy Gurkovskiy, Chief Analyst at RoboForex
Early in August, Brent is slightly correcting downwards ad trading at $43.37. While the news flow is quite calm, investors continue monitoring supply and demand in the oil sector, and frankly, they don’t like what the see.
A new stage of the OPEC+ agreement is coming into effect. Starting from August 1st, the daily reduction of oil production is 7.7 million barrels, which is lower than the previous value, 9.7 barrels. This restriction is supposed to be valid for countries members of OPEC+ until the end of the year.
Market players are worried by the possibility of oversupply. It may well be that a stable price for oil might sooner or later boost the USA to increase oil extraction. This is exactly what is putting pressure on the oil right now.
Another thing that pushes the oil price is the coronavirus: the number of new cases is going up, which means that all pandemic-related risks are not going away anywhere.
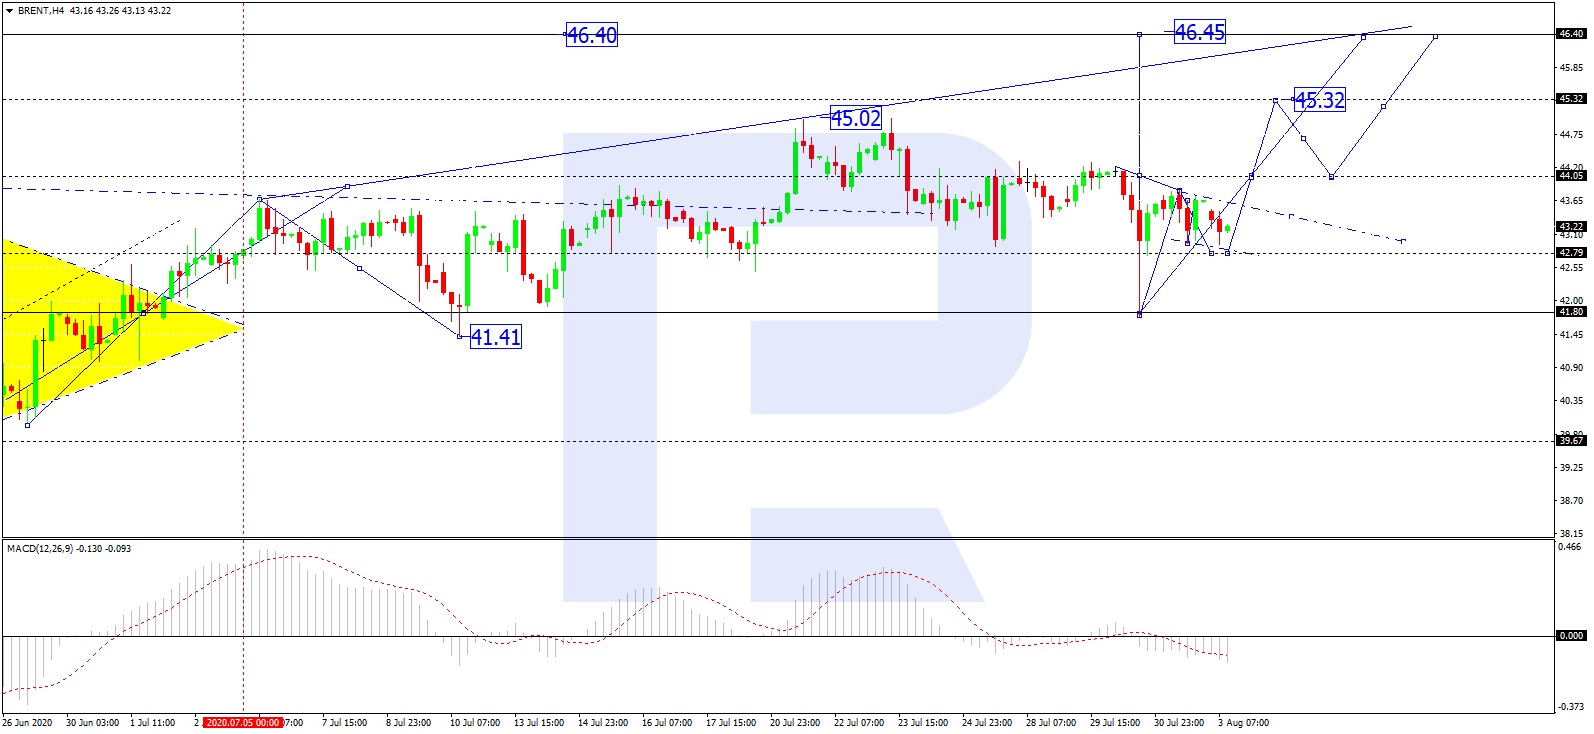
In the H4 chart, Brent is still correcting towards 42.80. After reaching this level, the asset may form one more ascending wave to break 44.04 and then continue trading upwards with the short-term target at 45.33. Later, the market may correct towards 44.50 and then start another growth to reach 46.46. From the technical point of view, this scenario is confirmed by MACD Oscillator: its signal line is moving below 0 in the histogram area. After the line leaves the area and breaks 0 to the upside, the correction may be over.
Free Reports:
 Get our Weekly Commitment of Traders Reports - See where the biggest traders (Hedge Funds and Commercial Hedgers) are positioned in the futures markets on a weekly basis.
 Sign Up for Our Stock Market Newsletter – Get updated on News, Charts & Rankings of Public Companies when you join our Stocks Newsletter
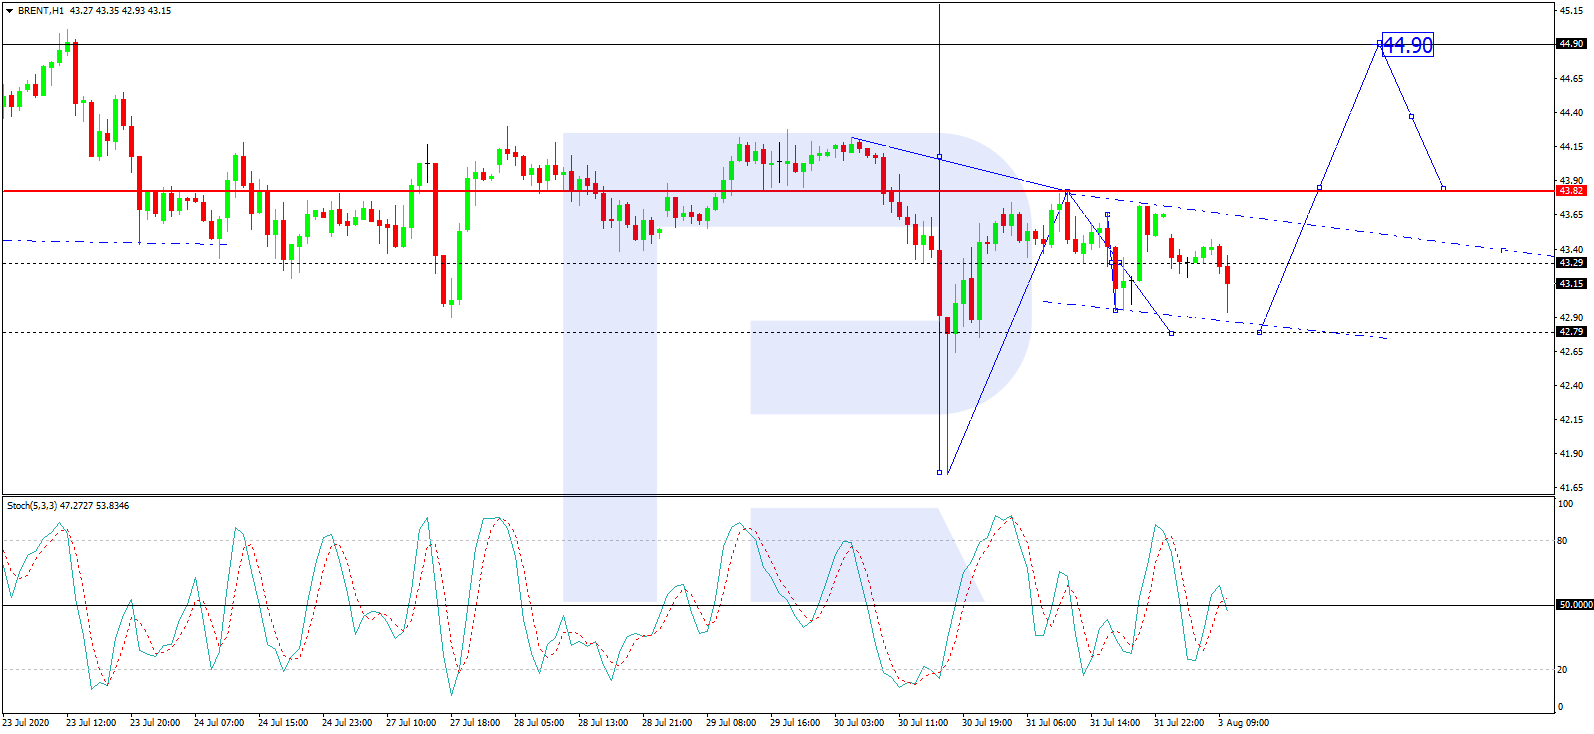
As we can see in the H1 chart, Brent is consolidating around 43.30; it has already broken this level to the downside and may continue falling to reach the correctional target at 42.80. After that, the instrument may start a new growth to break 43.30 and then continue trading upwards to reach 44.04. And that’s just a half of another ascending wave. From the technical point of view, this idea is confirmed by Stochastic Oscillator: its signal line is moving to rebound from 50 to the downside. Later, the line is expected to fall to reach 20 and rebound from it. After that, the correction may be over. If later the line breaks 50, the price chart may boost its growth.
Disclaimer
Any forecasts contained herein are based on the author’s particular opinion. This analysis may not be treated as trading advice. RoboForex bears no responsibility for trading results based on trading recommendations and reviews contained herein.

- Target Thursdays: NAS100, Robusta Coffee, USDCHF Apr 25, 2024
- QCOM wants to create competition in the AI chip market. Hong Kong index hits five-month high Apr 25, 2024
- Japanese yen hits all-time low as BoJ meeting commences Apr 25, 2024
- TSLA shares rose on a weak report. Inflationary pressures are easing in Australia Apr 24, 2024
- USDJPY: On intervention watch Apr 24, 2024
- Euro gains against the dollar amid mixed economic signals Apr 24, 2024
- PMI data is the focus of investors’ attention today. Turkey, Iraq, Qatar, and UAE signed a transportation agreement Apr 23, 2024
- Australian dollar rises on strong economic indicators Apr 23, 2024
- Geopolitical risks in the Middle East are declining. China kept interest rates at lows Apr 22, 2024
- Brent crude dips to four-week low amid easing geopolitical tensions Apr 22, 2024