
Article By RoboForex.com
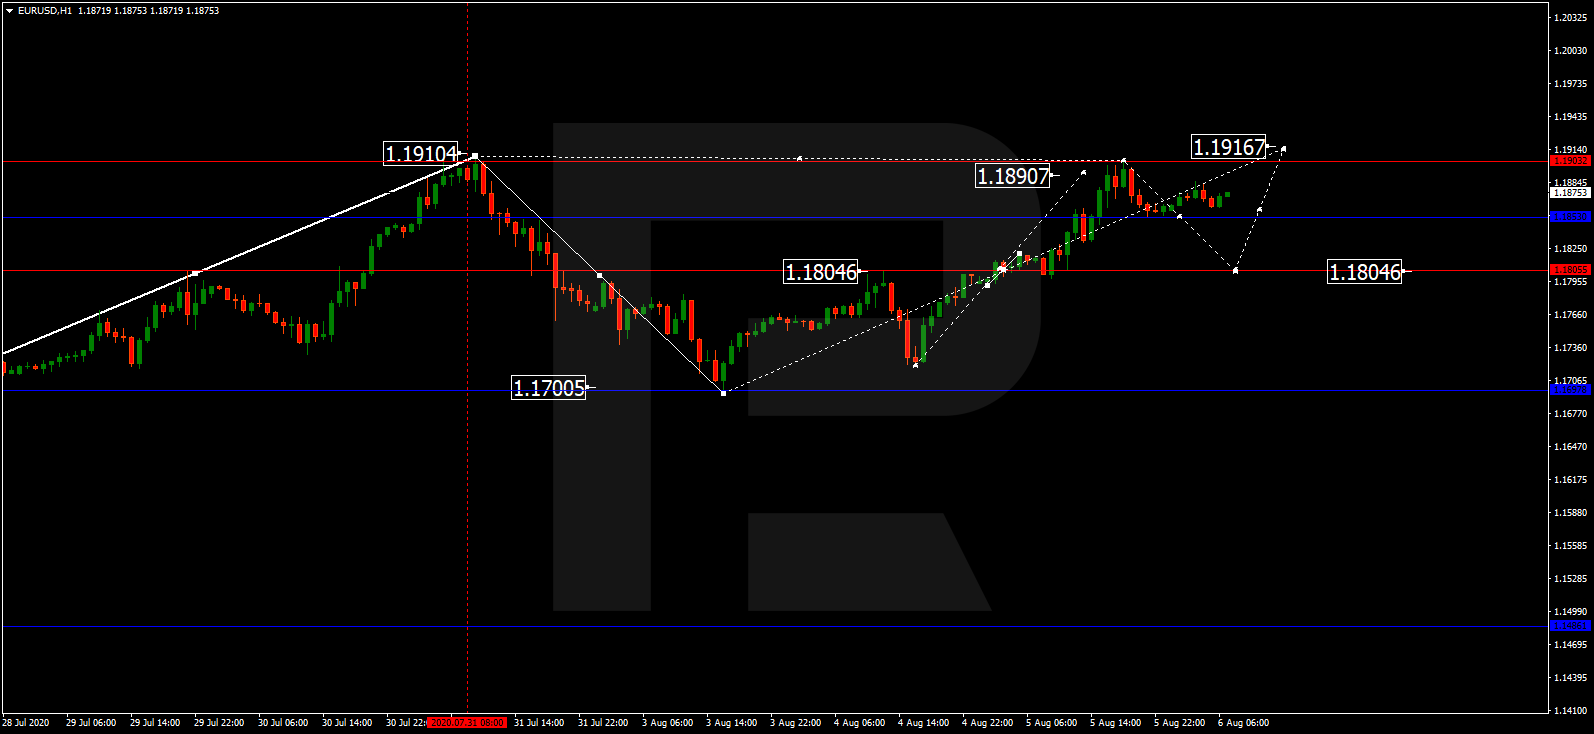
EURUSD, “Euro vs US Dollar”
After reaching 1.1805 and then breaking it to the upside, EURUSD has reached 1.1904. Possibly, the pair may correct towards 1.1805 and then form one more ascending structure with the target at 1.1916. In fact, the market continues forming a wide consolidation range around 1.1805.

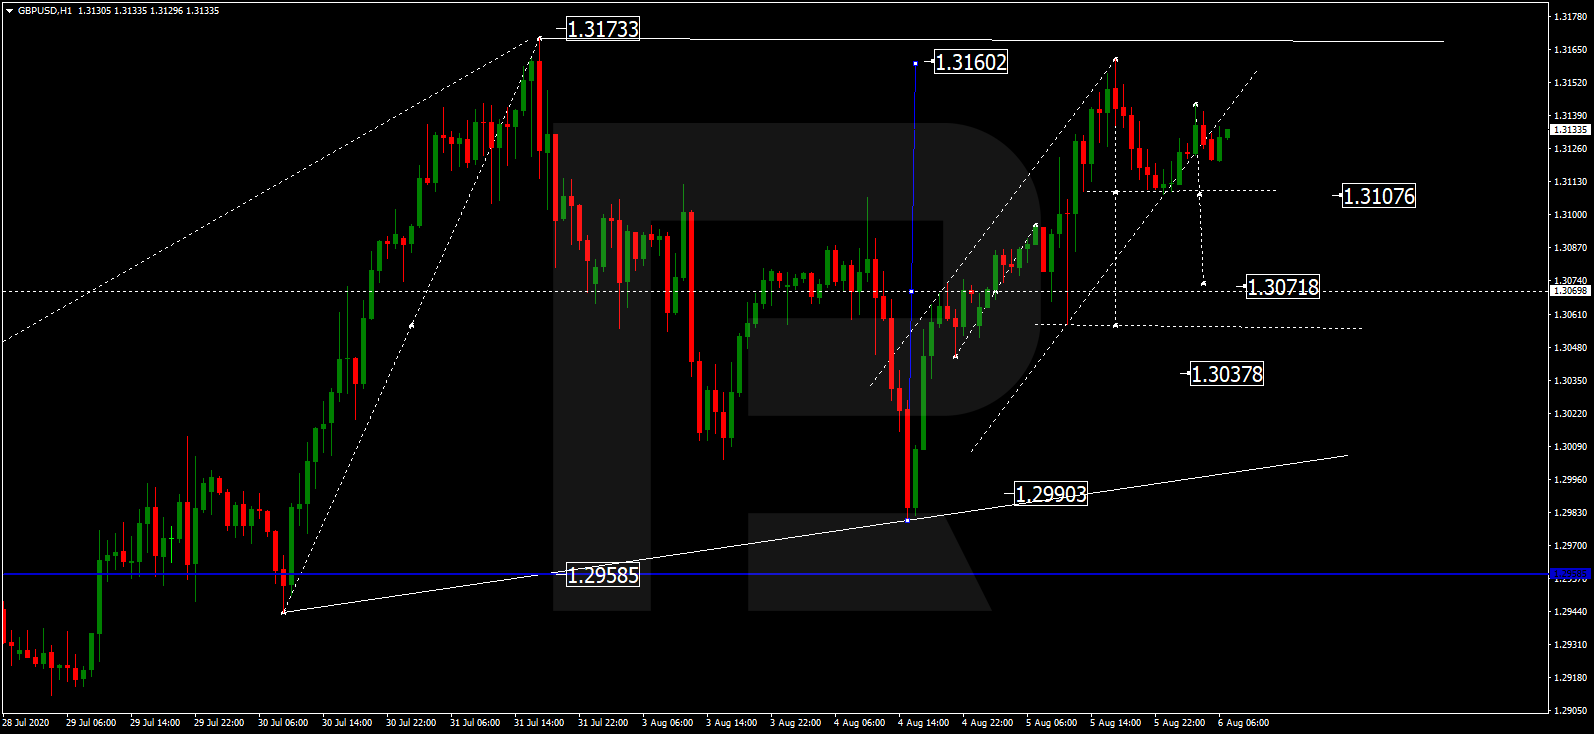
GBPUSD, “Great Britain Pound vs US Dollar”
After rebounding from 1.3071 and then completing another ascending structure at 1.3160, GBPUSD is expected to fall towards 1.3071 and then move upwards with the target at 1.3175. In fact, the instrument continues forming a wide consolidation range around 1.3071.
Free Reports:
 Download Our Metatrader 4 Indicators – Put Our Free MetaTrader 4 Custom Indicators on your charts when you join our Weekly Newsletter
 Get our Weekly Commitment of Traders Reports - See where the biggest traders (Hedge Funds and Commercial Hedgers) are positioned in the futures markets on a weekly basis.
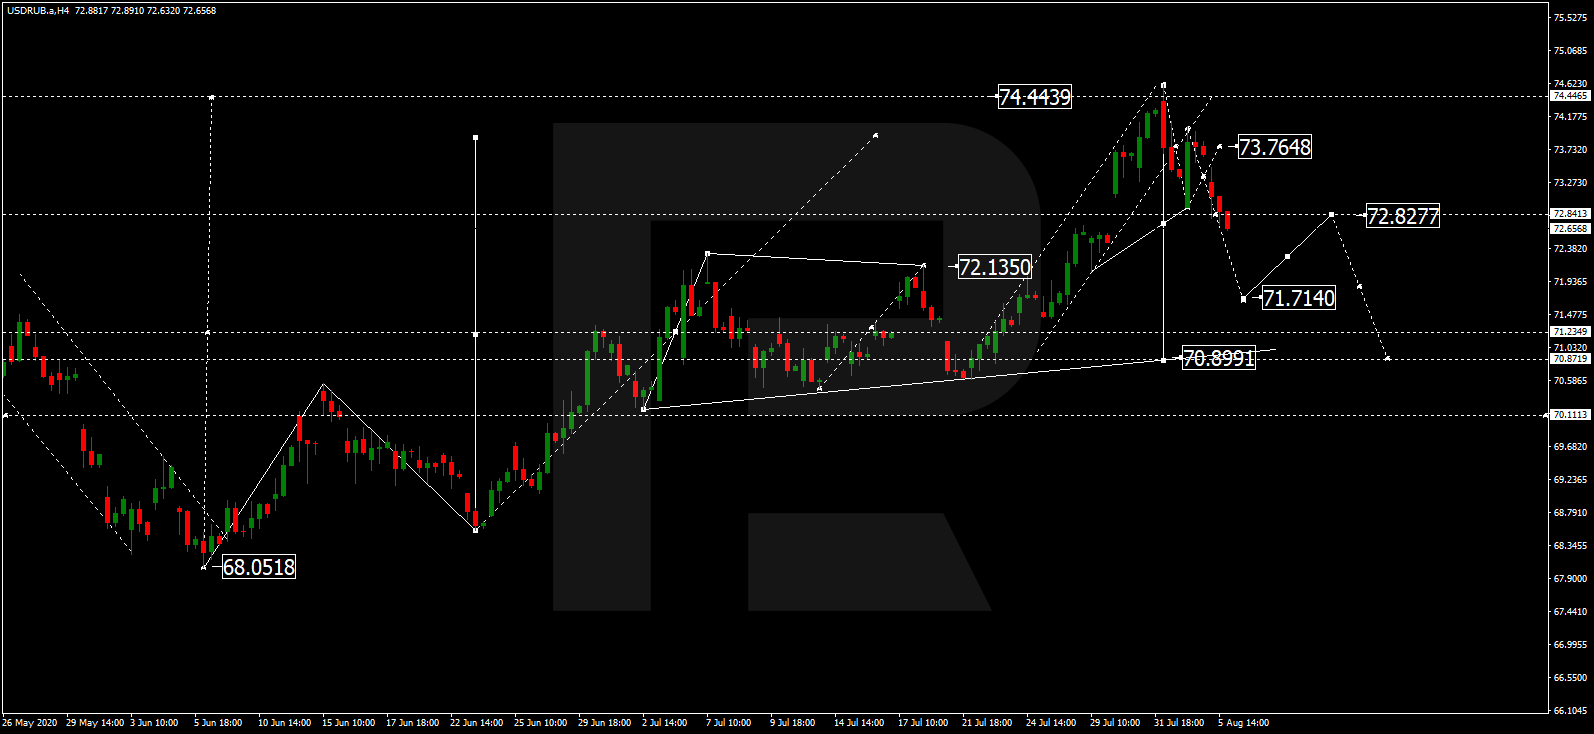
USDRUB, “US Dollar vs Russian Ruble”
USDRUB is moving to break 72.80 to the downside. Possibly, the pair may form a new descending structure with the short-term target at 71.71 and then start another correction to return to 72.80. After that, the instrument may resume trading downwards with the first target at 70.90.
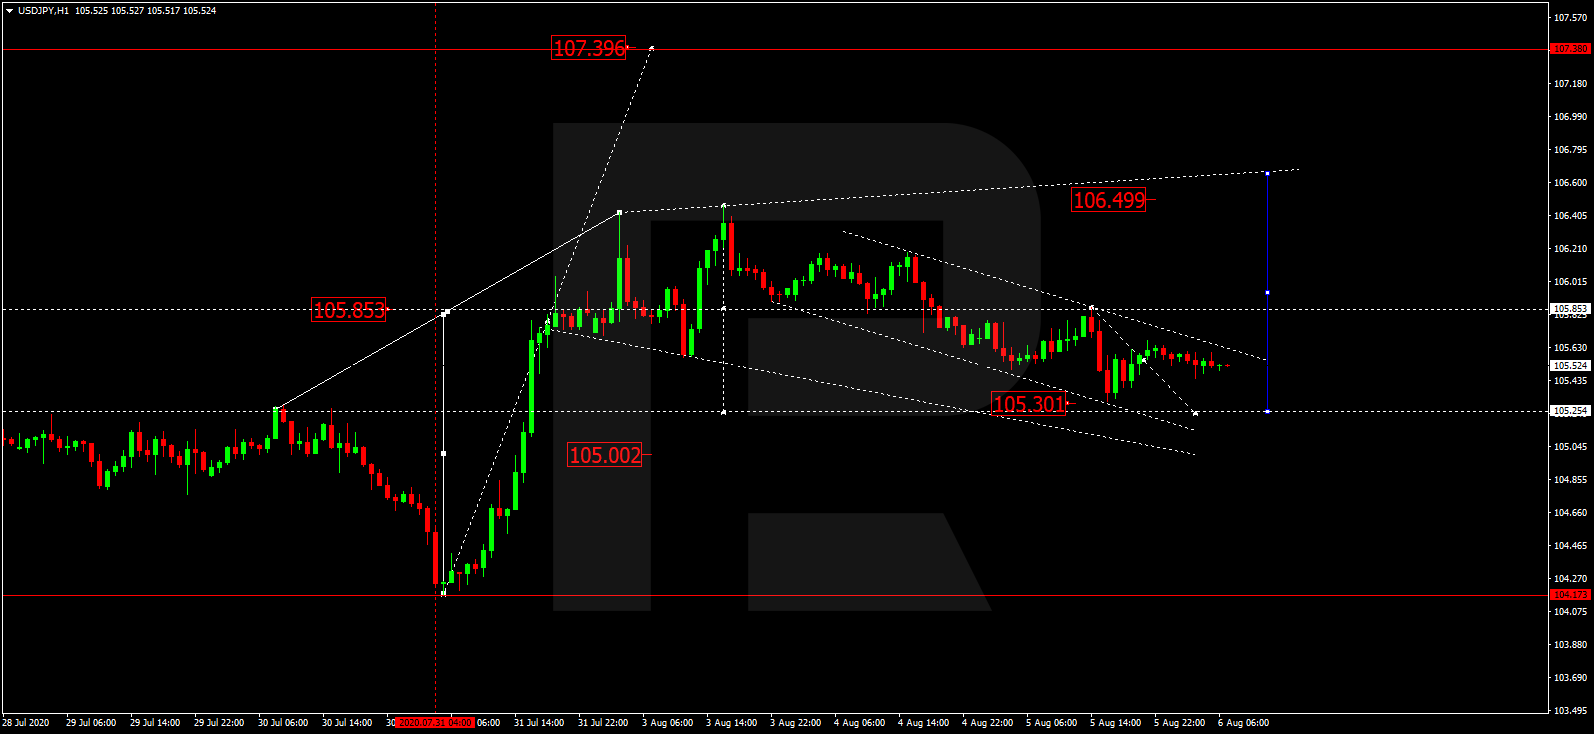
USDJPY, “US Dollar vs Japanese Yen”
USDJPY is correcting. Today, the pair may fall to reach at least 105.25 and then start another growth to break 105.85. After that, the instrument may continue trading upwards with the target at 106.50.
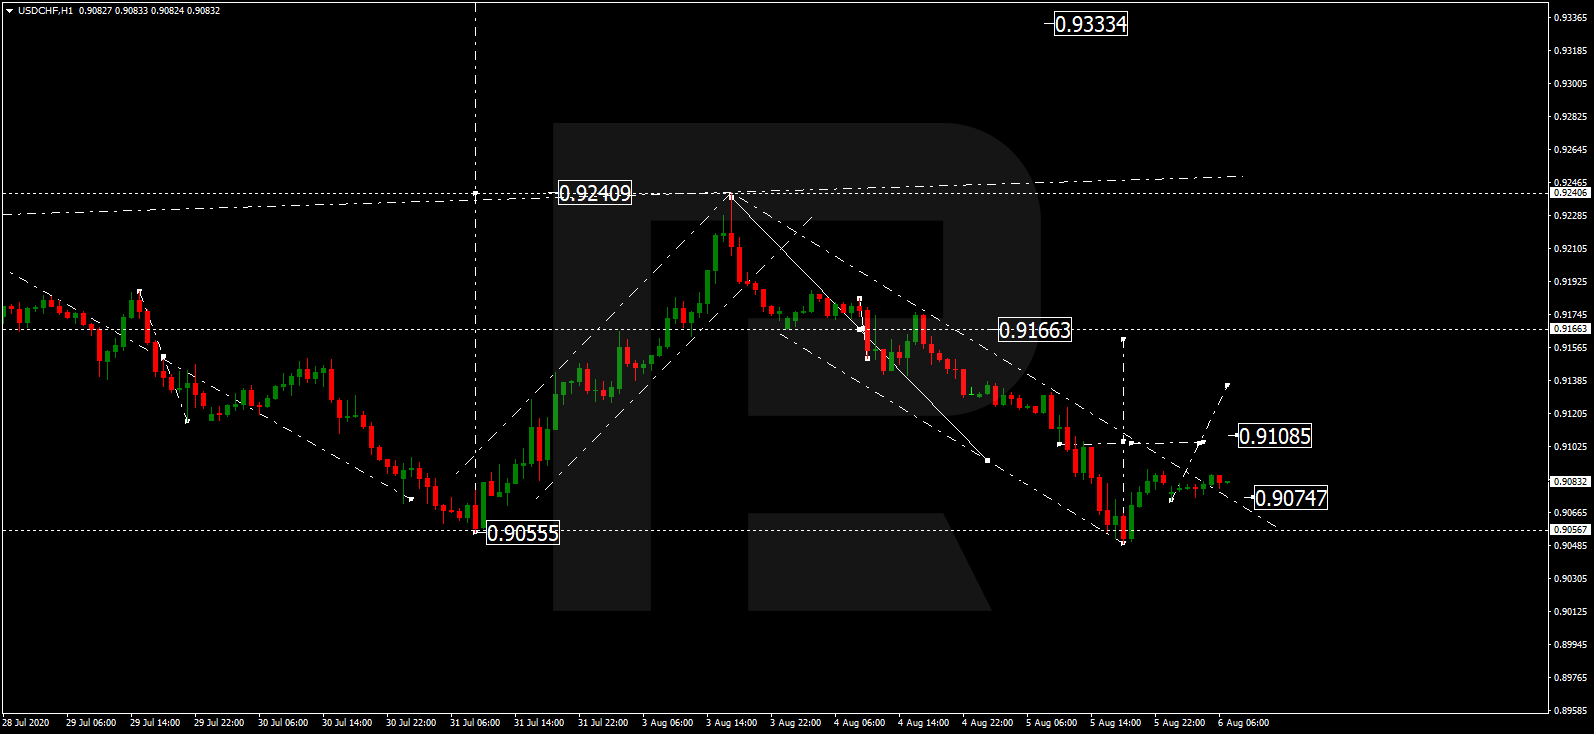
USDCHF, “US Dollar vs Swiss Franc”
After finishing the descending structure at 0.9050, USDCHF is moving upwards to break 0.9080 and may later reach 0.9166. After that, the instrument may start a new decline towards 0.9100. In fact, the market continues forming a wide consolidation range around 0.9166.
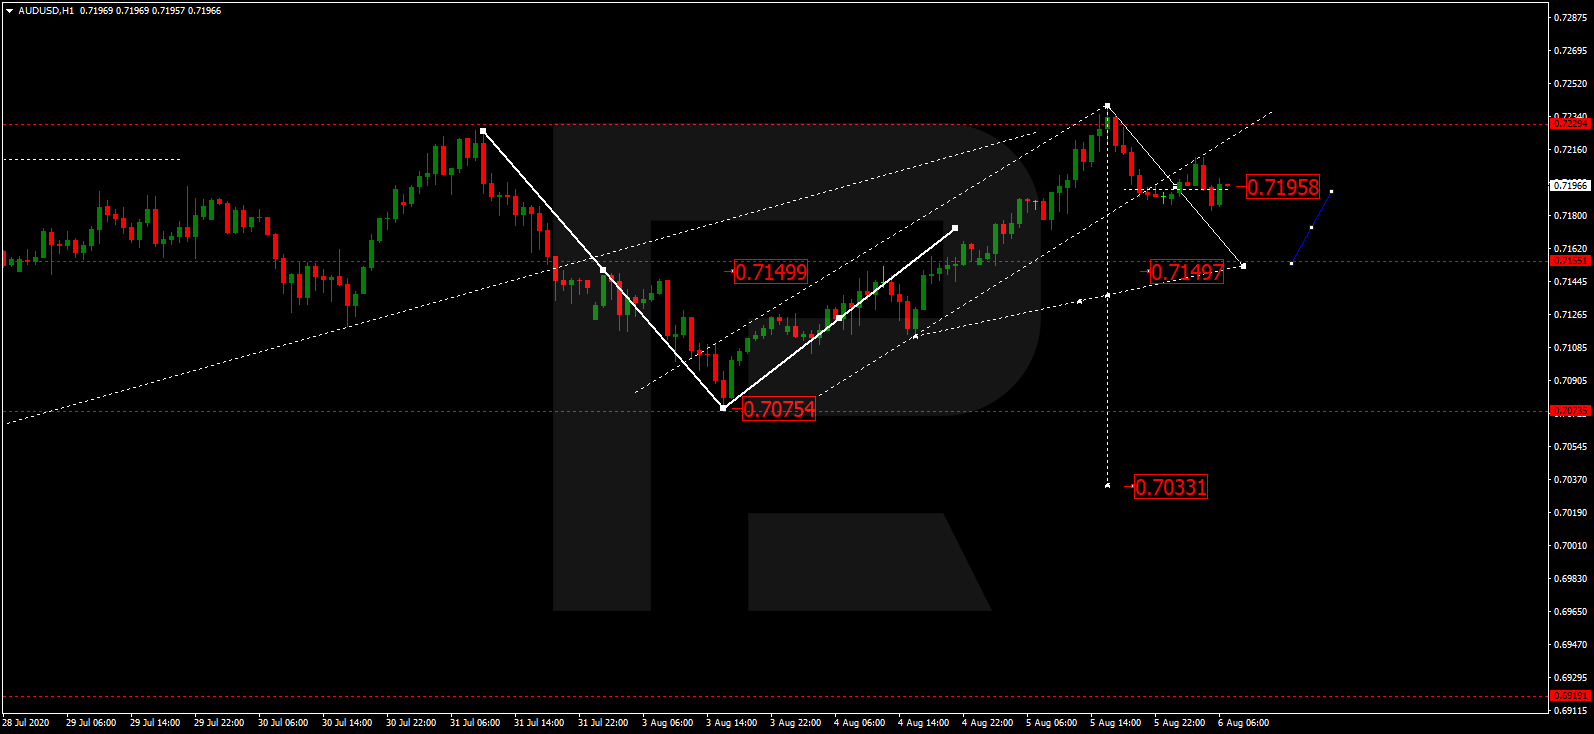
AUDUSD, “Australian Dollar vs US Dollar”
After completing another ascending structure at 0.7233, AUDUSD is expected to fall towards 0.7149. Later, the market may start another growth to reach 0.7195. In fact, the instrument continues forming a wide consolidation range around 0.7149.
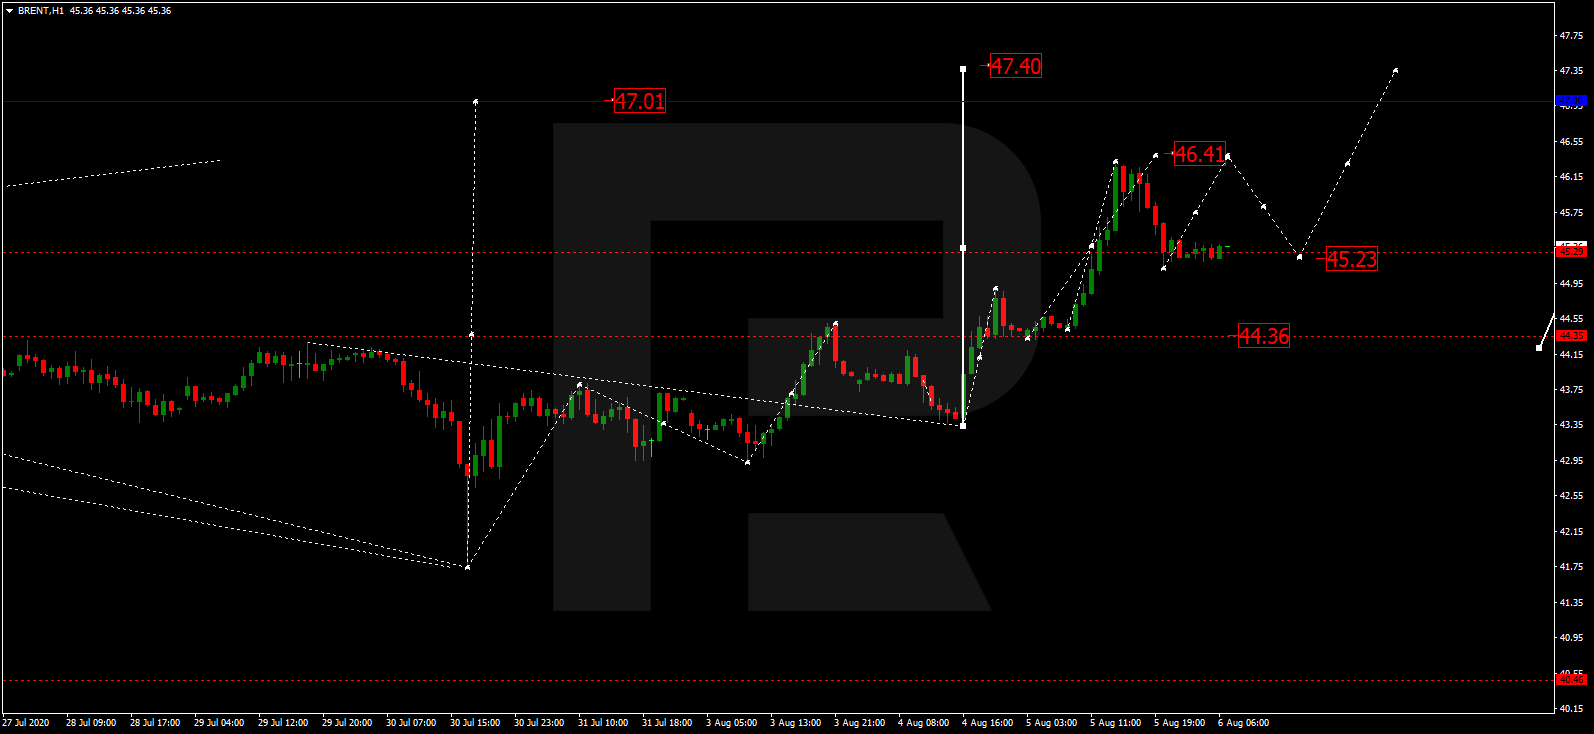
BRENT
After reaching 46.40 and then finishing the correction at 45.25, Brent is still trading upwards. Possibly, today the pair may grow to reach 46.46 and then form a new descending structure towards 45.40. Later, the market may resume trading upwards with the target at 47.44.
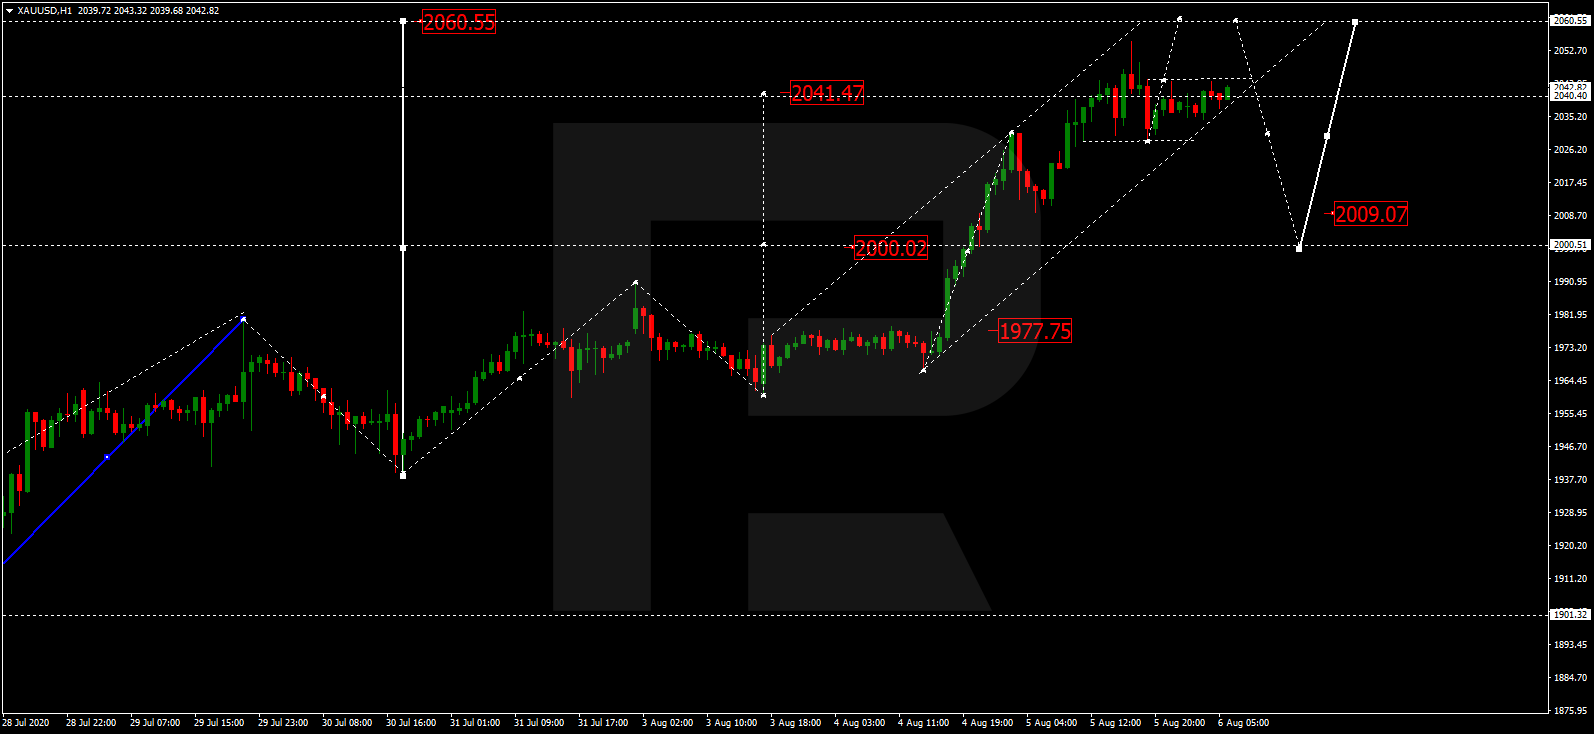
XAUUSD, “Gold vs US Dollar”
After finishing the ascending wave at 2052.50, Gold is consolidating around 2040.40. Possibly, the pair may correct downwards to reach 1000.02 and then form one more ascending structure with the target at 2060.50.
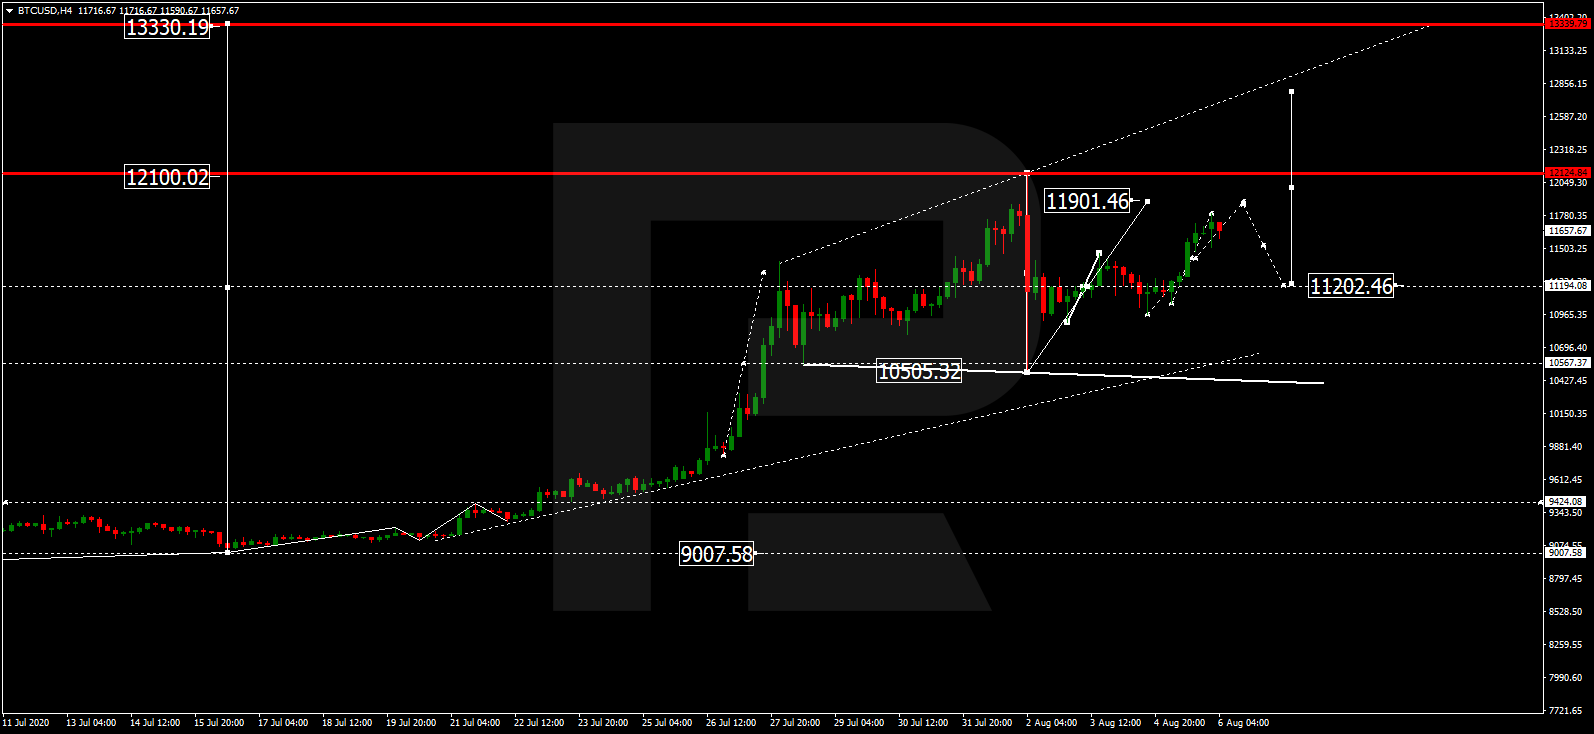
BTCUSD, “Bitcoin vs US Dollar”
BTCUSD is still growing; it has broken 11500.00 and may continue moving upwards to reach 11900.00. After that, the instrument may form a new descending structure towards 11200.00. In fact, the market continues forming a wide consolidation range around 11200.00.
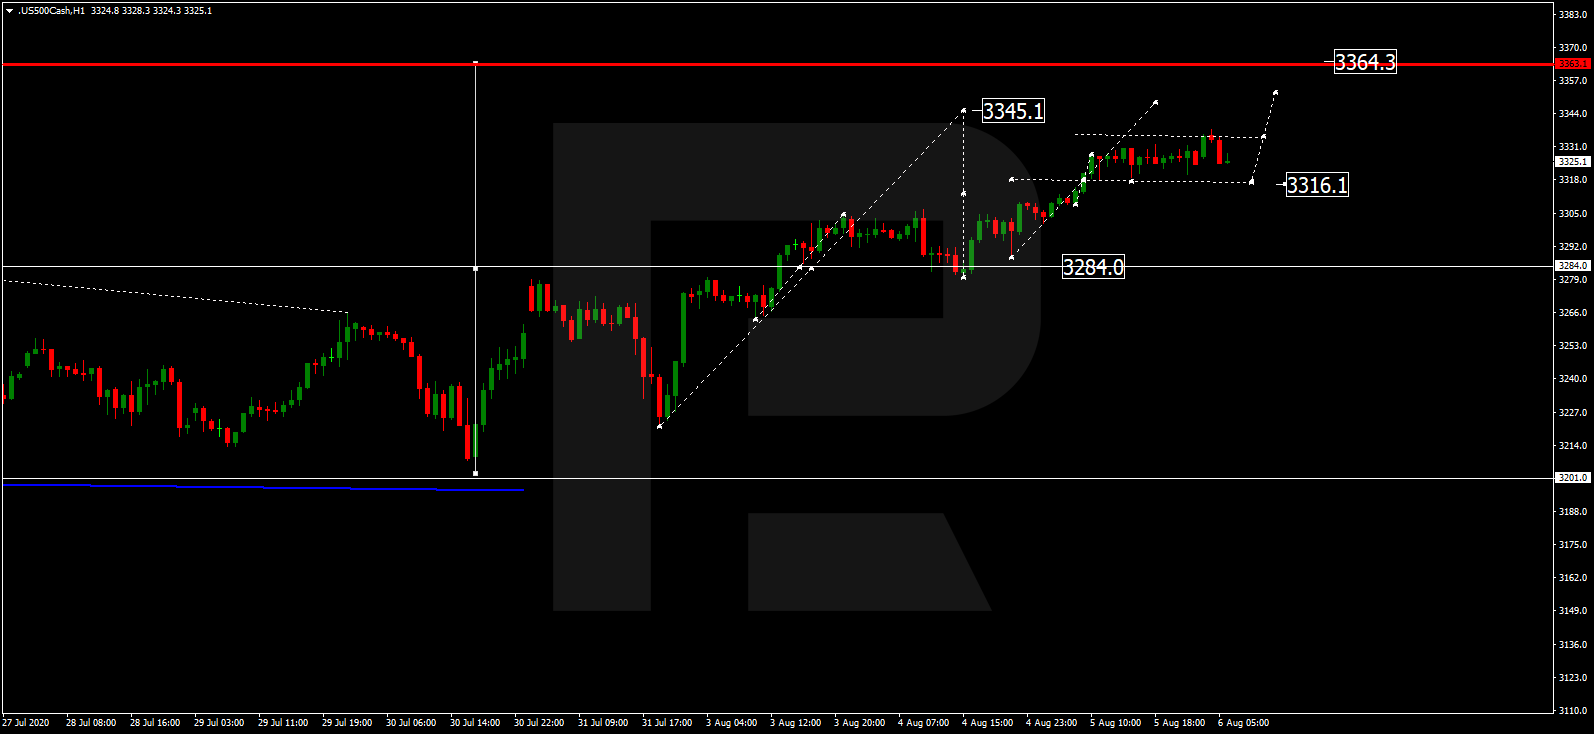
S&P 500
After breaking 3316.1 and forming a new consolidation range above this level, the S&P index is trading upwards with the target at 3345.1. Later, the market may start a new correction towards 3284.0.
Article By RoboForex.com
Attention!
Forecasts presented in this section only reflect the author’s private opinion and should not be considered as guidance for trading. RoboForex LP bears no responsibility for trading results based on trading recommendations described in these analytical reviews.

- TSLA shares rose on a weak report. Inflationary pressures are easing in Australia Apr 24, 2024
- USDJPY: On intervention watch Apr 24, 2024
- Euro gains against the dollar amid mixed economic signals Apr 24, 2024
- PMI data is the focus of investors’ attention today. Turkey, Iraq, Qatar, and UAE signed a transportation agreement Apr 23, 2024
- Australian dollar rises on strong economic indicators Apr 23, 2024
- Geopolitical risks in the Middle East are declining. China kept interest rates at lows Apr 22, 2024
- Brent crude dips to four-week low amid easing geopolitical tensions Apr 22, 2024
- COT Metals Charts: Speculator bets led by Copper & Silver Apr 20, 2024
- COT Bonds Charts: Speculator bets led by 10-Year Bonds & Fed Funds Apr 20, 2024
- COT Stock Market Charts: Speculator bets led by S&P500-Mini Apr 20, 2024